Diagnostics
Module: Assets → Diagnostics
URL: https://hiev.ca/ca/diagnostics
Audience: CPMS Administrators, Technical Operations Engineers, and Site Maintenance Teams
1. Purpose & Overview
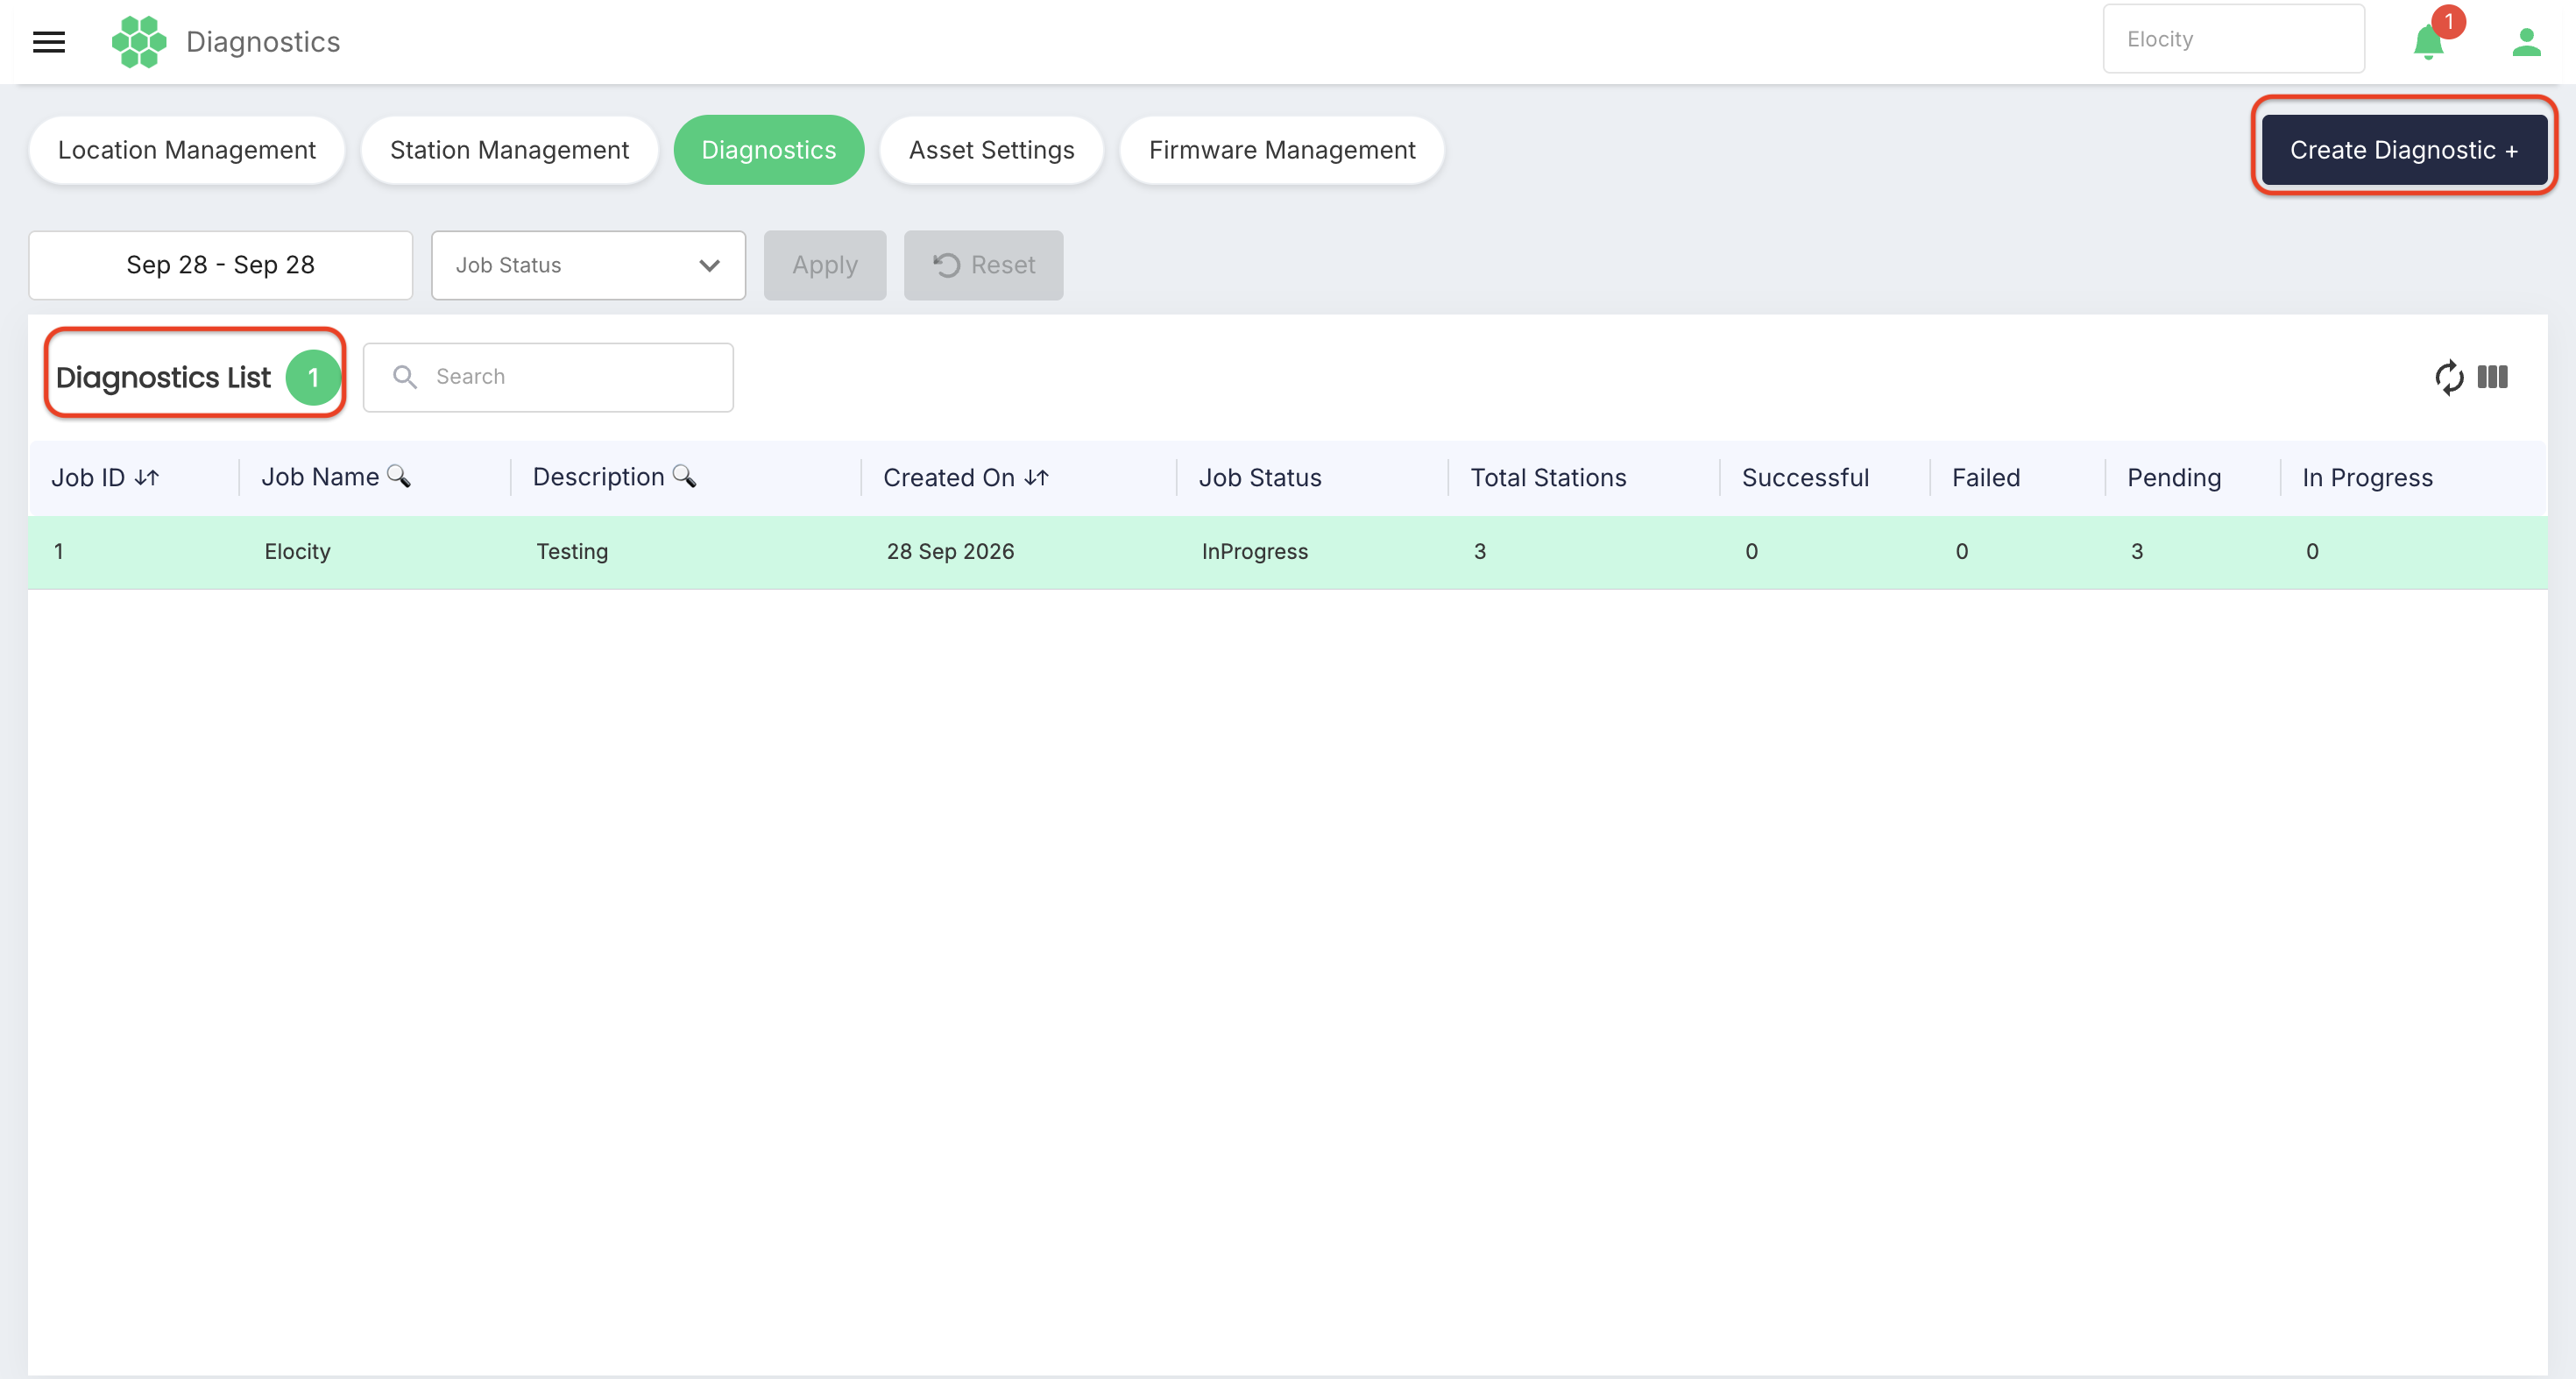
The Diagnostics module provides a centralized management hub for scheduling, initiating, monitoring, and downloading EVSE diagnostic log collections across charging stations.
Using standard OCPP diagnostic commands (GetDiagnostics), administrators can retrieve technical operational logs from one or multiple charging stations over a specified historical time window to troubleshoot hardware faults, network latency, communication drops, and firmware behavior.
The module provides three interconnected work areas:
- Diagnostics List — View, search, and filter diagnostic jobs by date range and job status.
- Create Diagnostic — Create and dispatch diagnostic log collection jobs for selected stations.
- View Job Details — Click on any diagnostic job to view its details and download logs.
2. Accessing Diagnostics
- Sign in to the HIEV Administration Portal.
- Confirm the required business in the top business selector.
- Open Assets from the main navigation menu.
- Select Diagnostics from the top module navigation pill bar.
3. Diagnostics Page Layout & Filtering
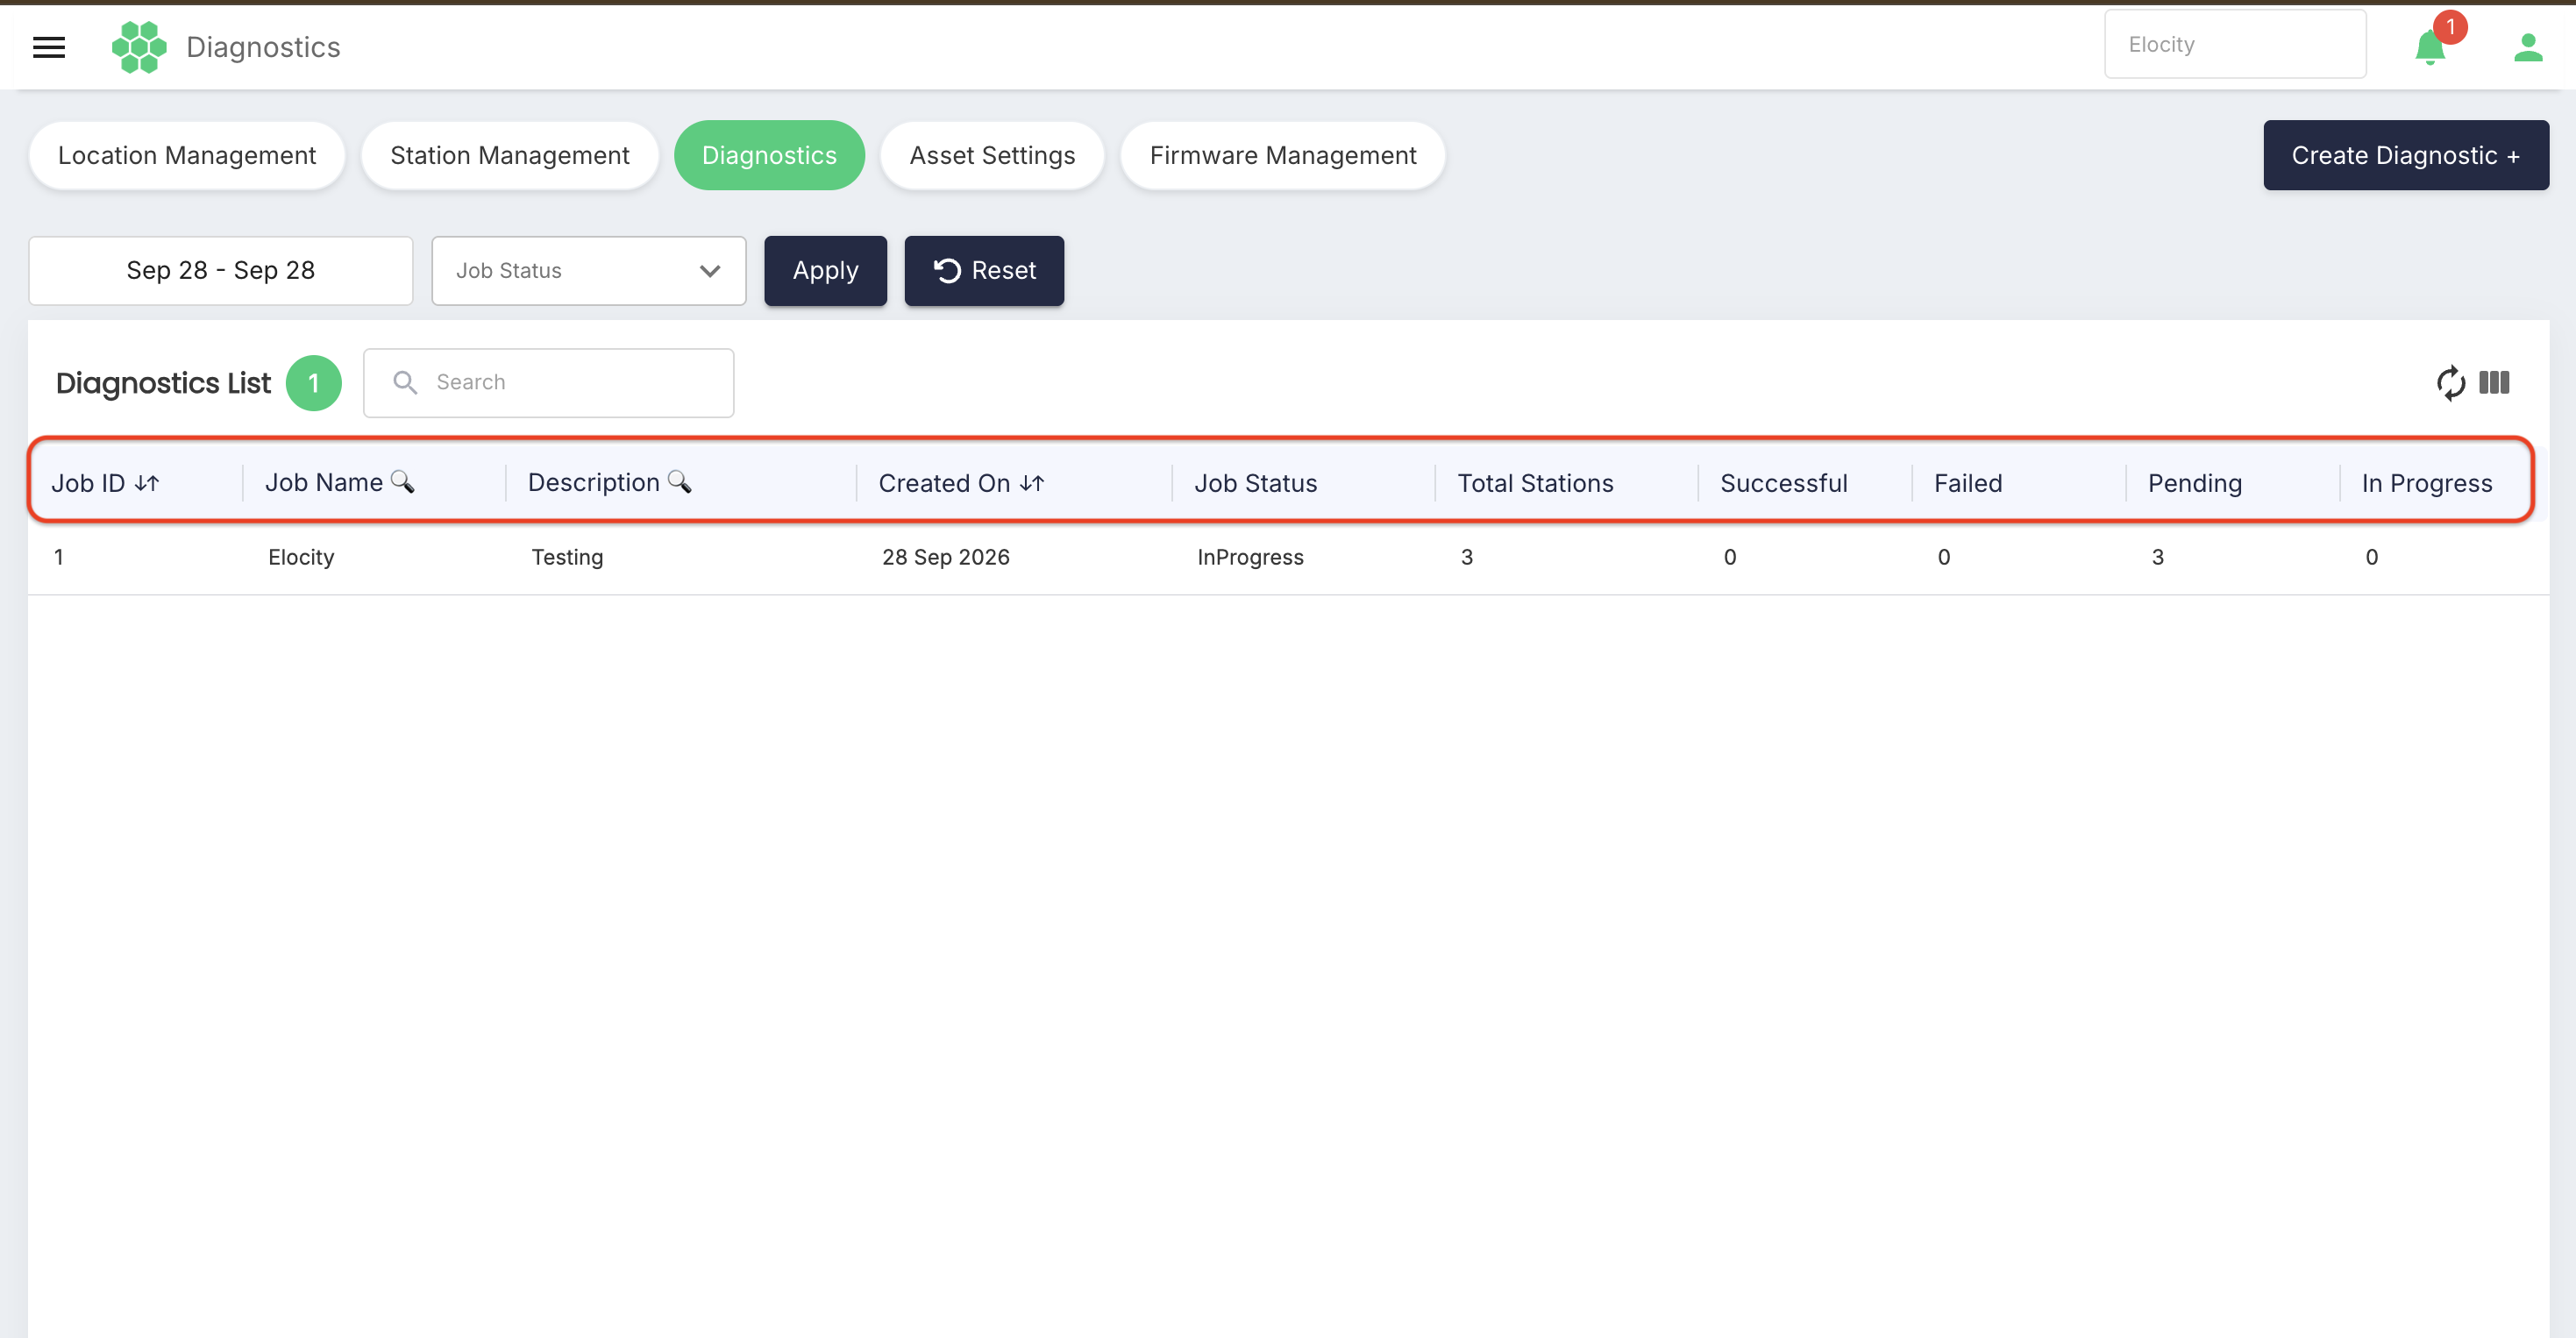
The main Diagnostics page consists of a top filter bar, toolbar controls, and the diagnostic jobs table.
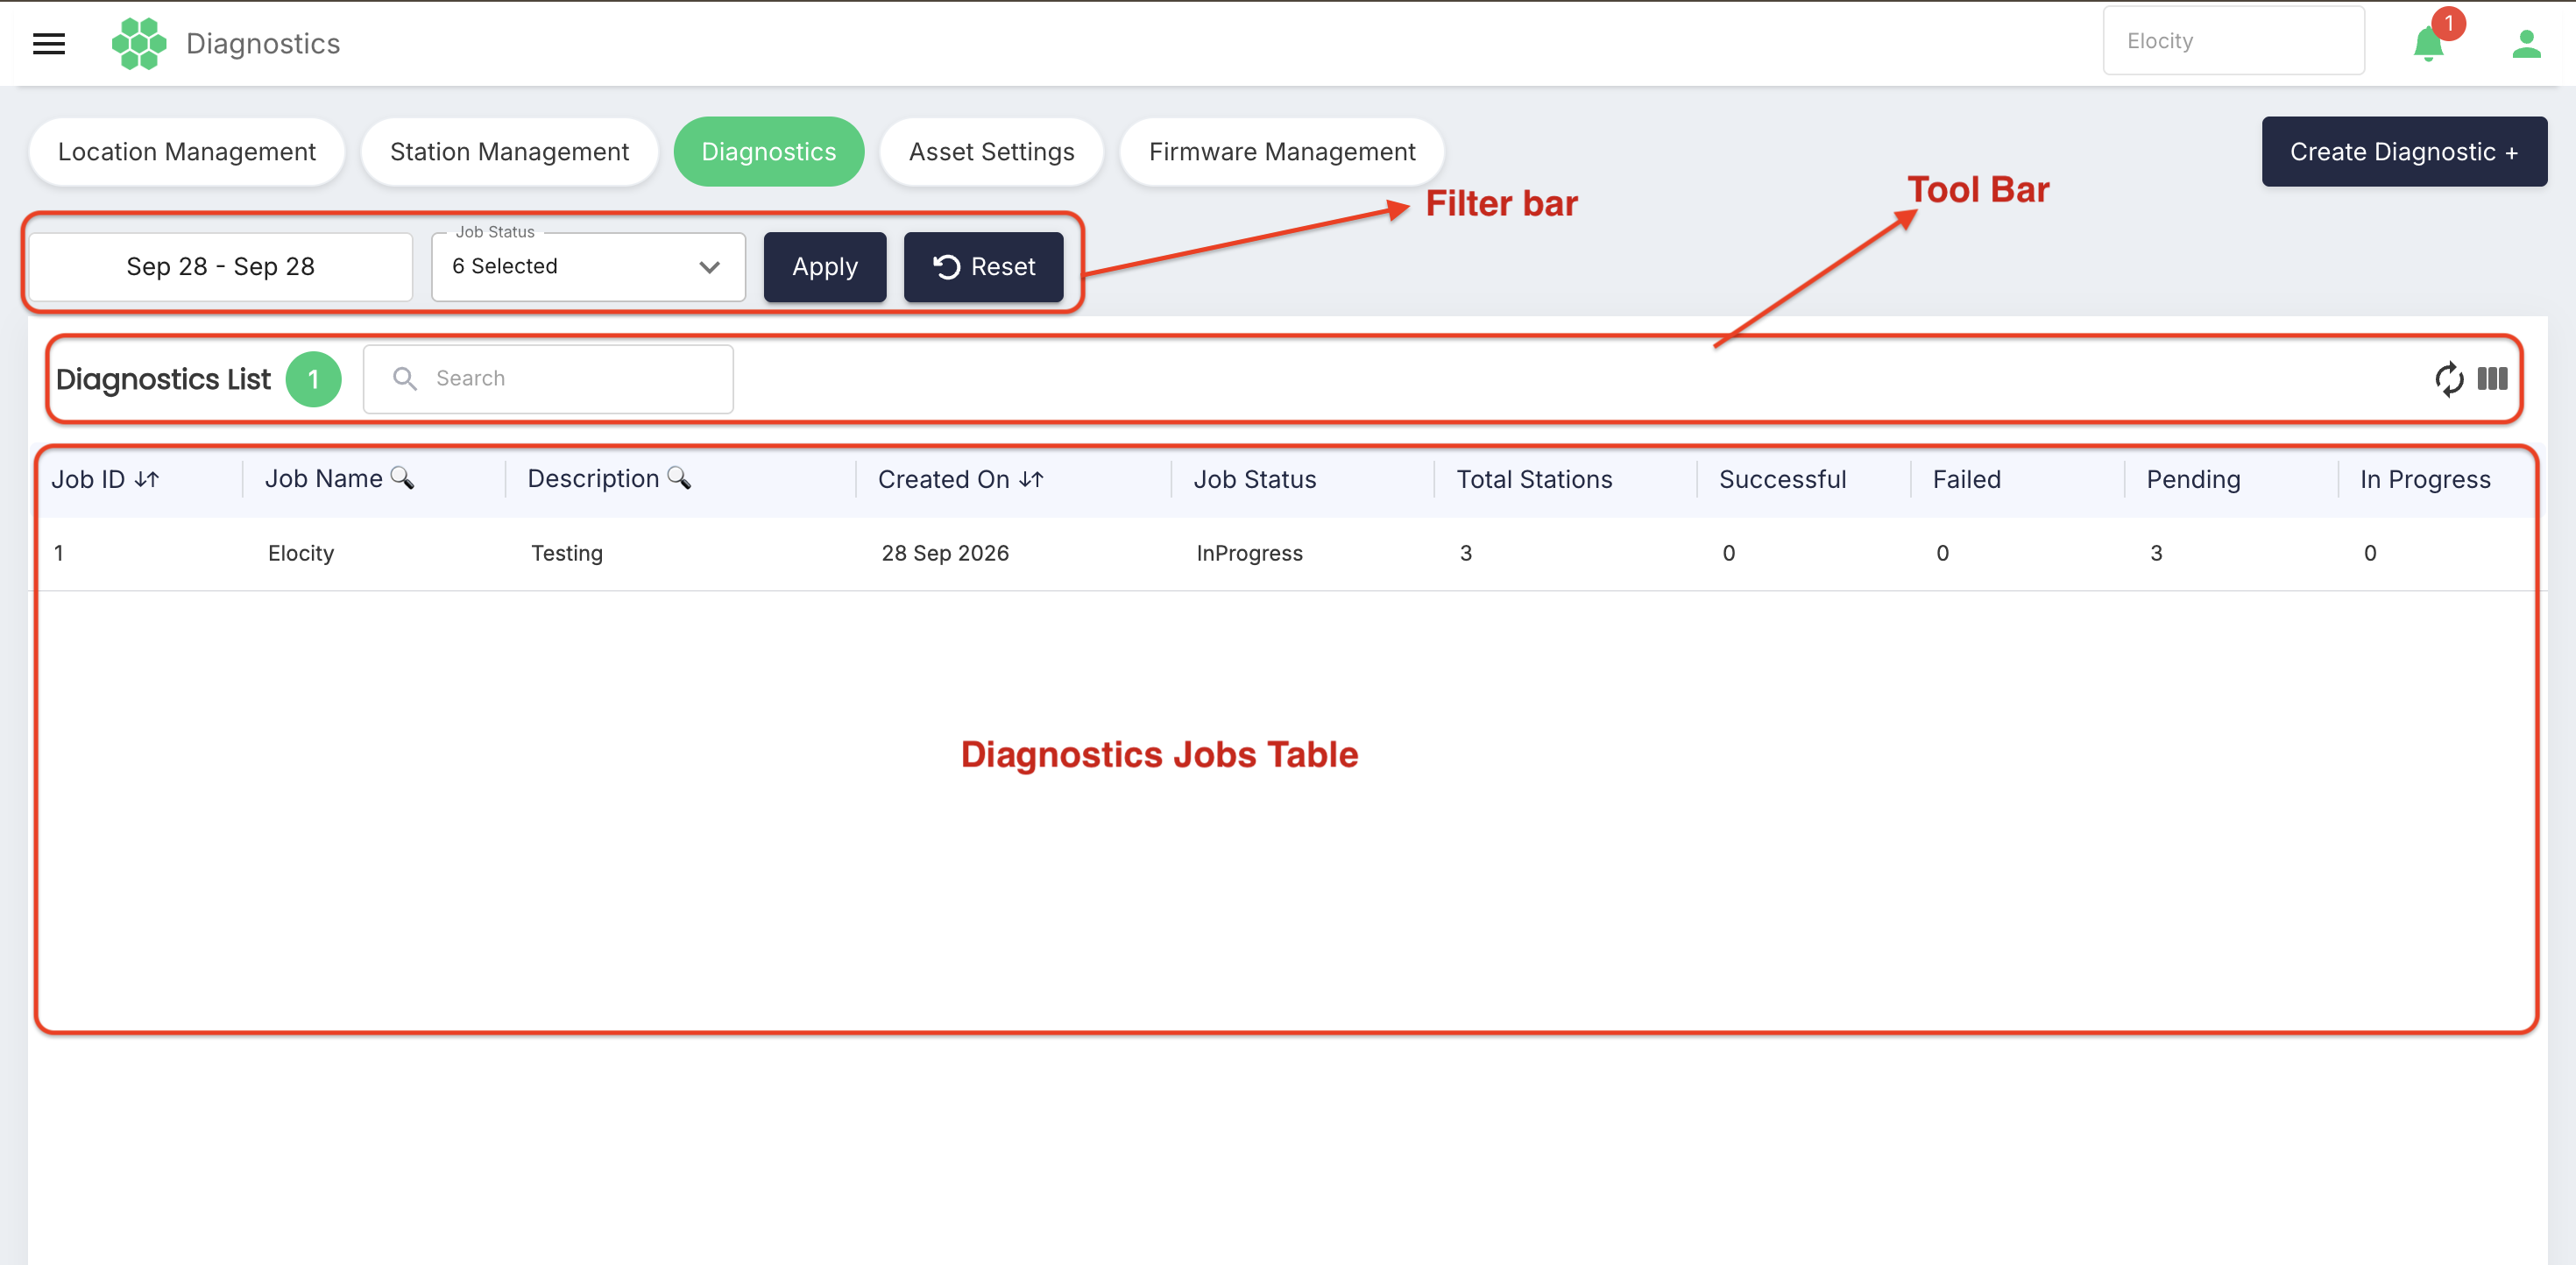
Filter Controls
| Filter | Control Type | Description |
|---|---|---|
| Date Range | Date Picker Button | Filters diagnostic jobs by their creation date (e.g., Sep 28 - Sep 28). Opens an interactive calendar for custom or preset ranges. |
| Job Status | Multi-Select Dropdown | Filters diagnostic jobs by their current execution state. |
Job Status Filter Options:
The Job Status multi-select dropdown provides the following options:
Select all— Selects all available status values.In Progress— Diagnostic jobs currently generating or uploading logs.Success— Diagnostic jobs that completed successfully across target stations.Failed— Diagnostic jobs where log retrieval could not be completed.Partial Success— Multi-station jobs where some stations succeeded and others failed.Pending— Diagnostic requests queued for dispatch.Dispatching— Diagnostic commands currently being transmitted to stations.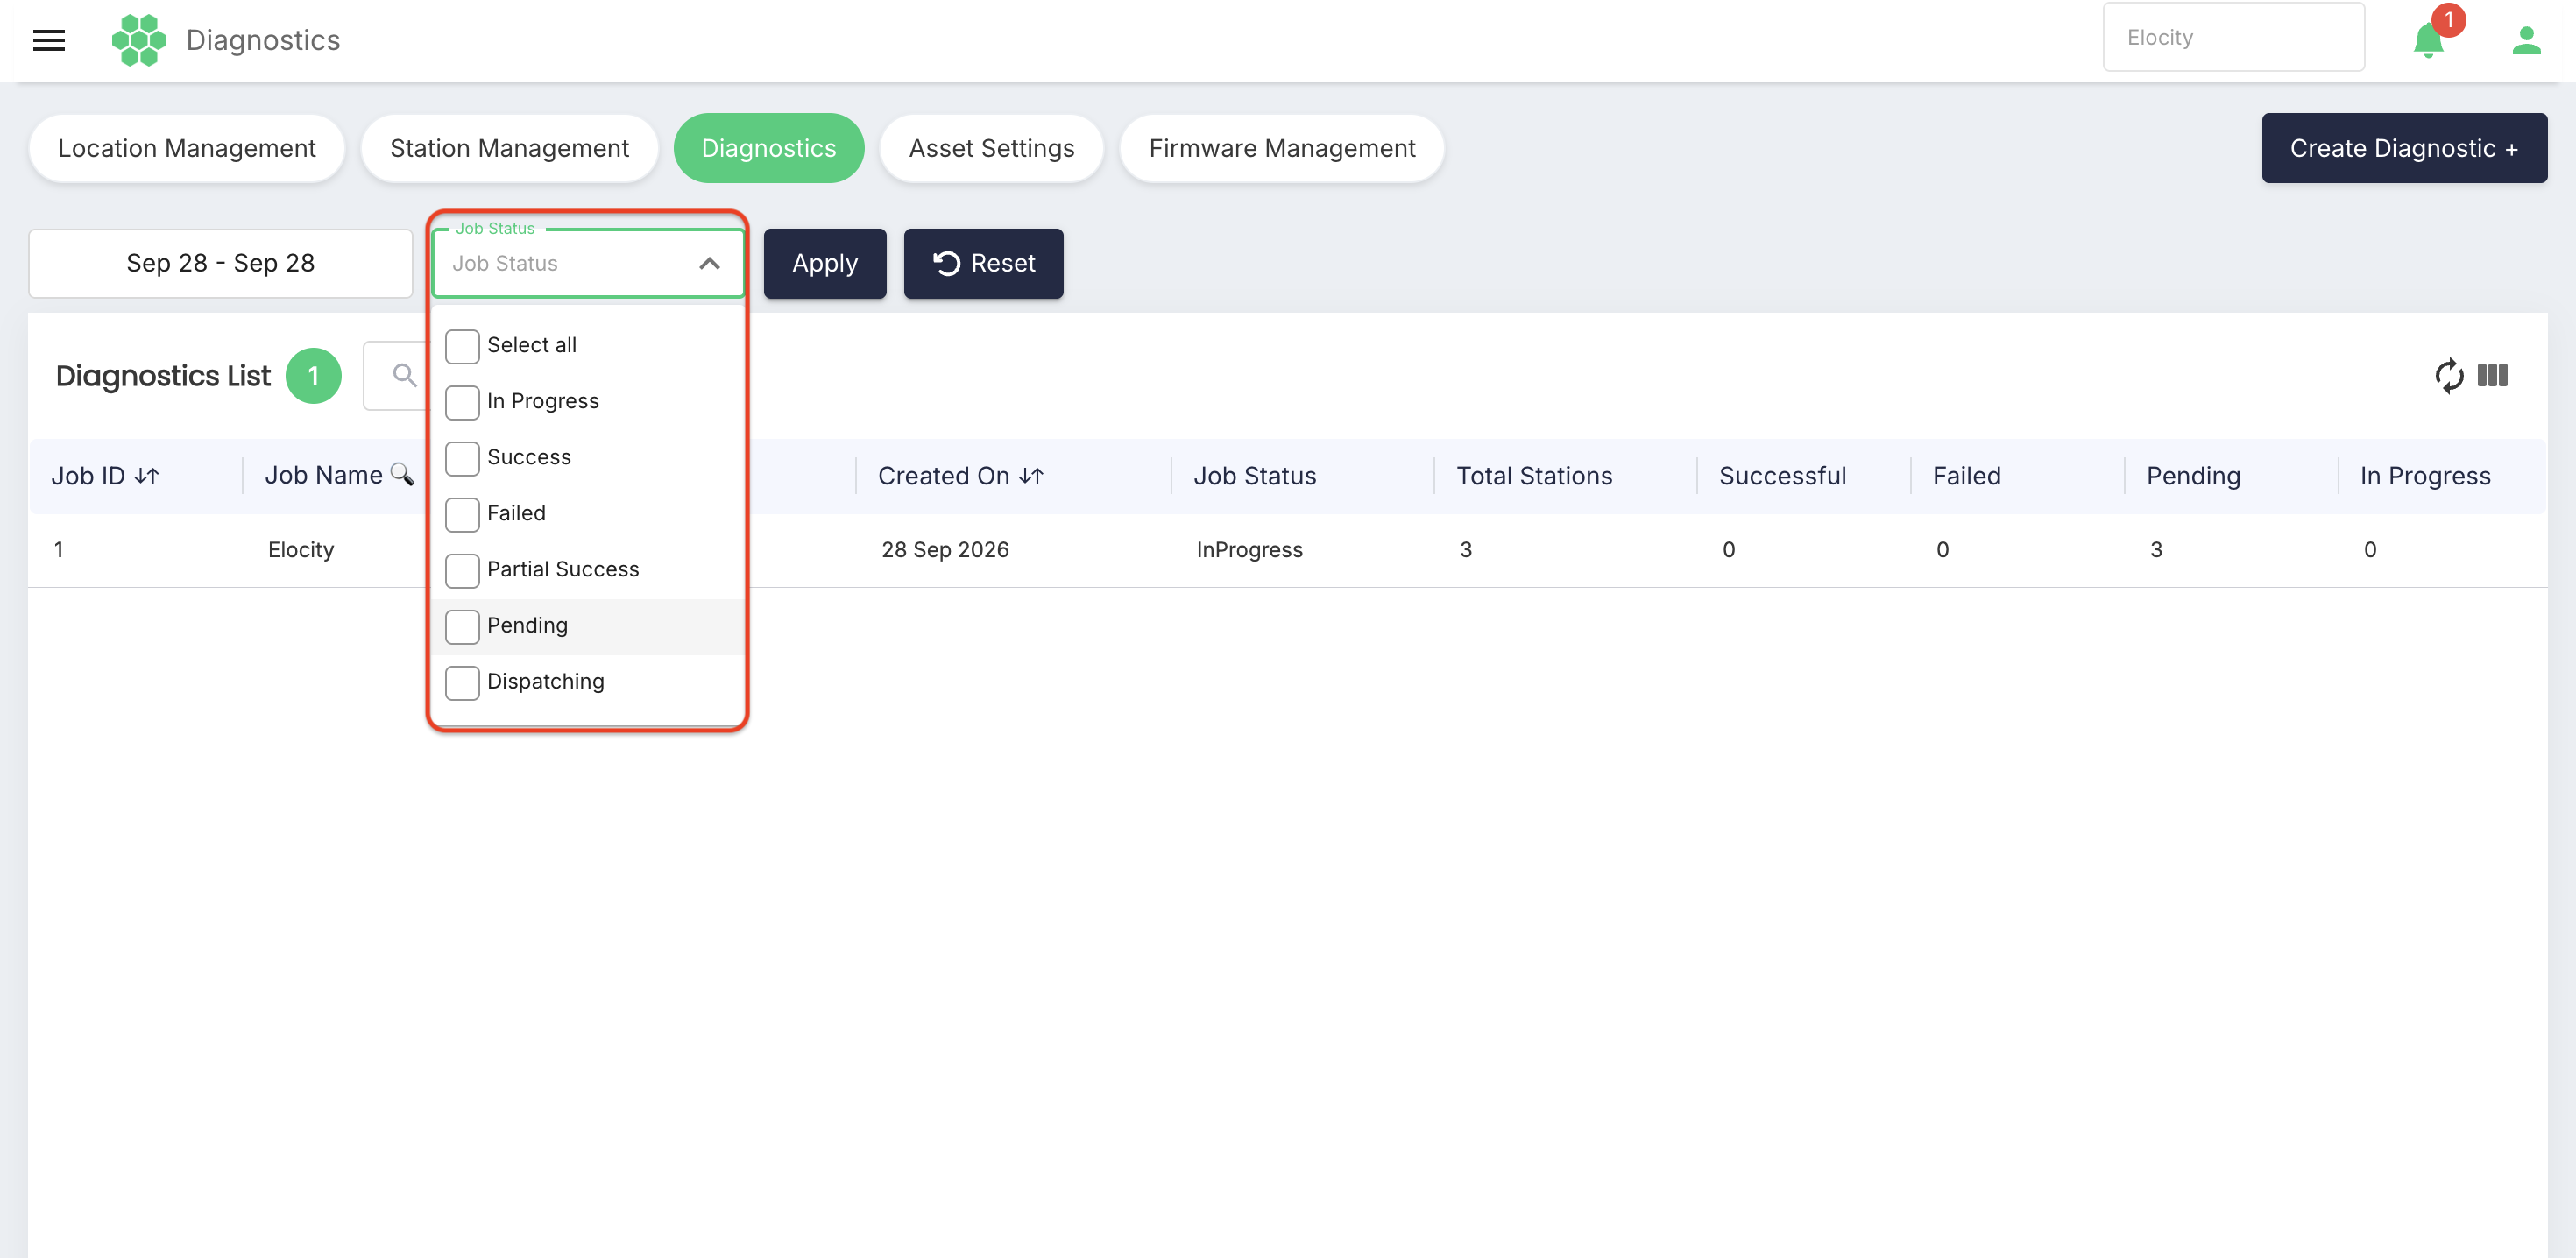
Select Apply to execute the filters. Select Reset (with counter-clockwise arrow) to clear all filters and restore default results.
4. Diagnostics Toolbar Controls
| Control | Description |
|---|---|
Diagnostics List [n] | Live count badge displaying the total number of diagnostic jobs matching the active filters (e.g., Diagnostics List 1). |
Search Bar 🔍 | Global search input to filter the visible table rows by job name or description. |
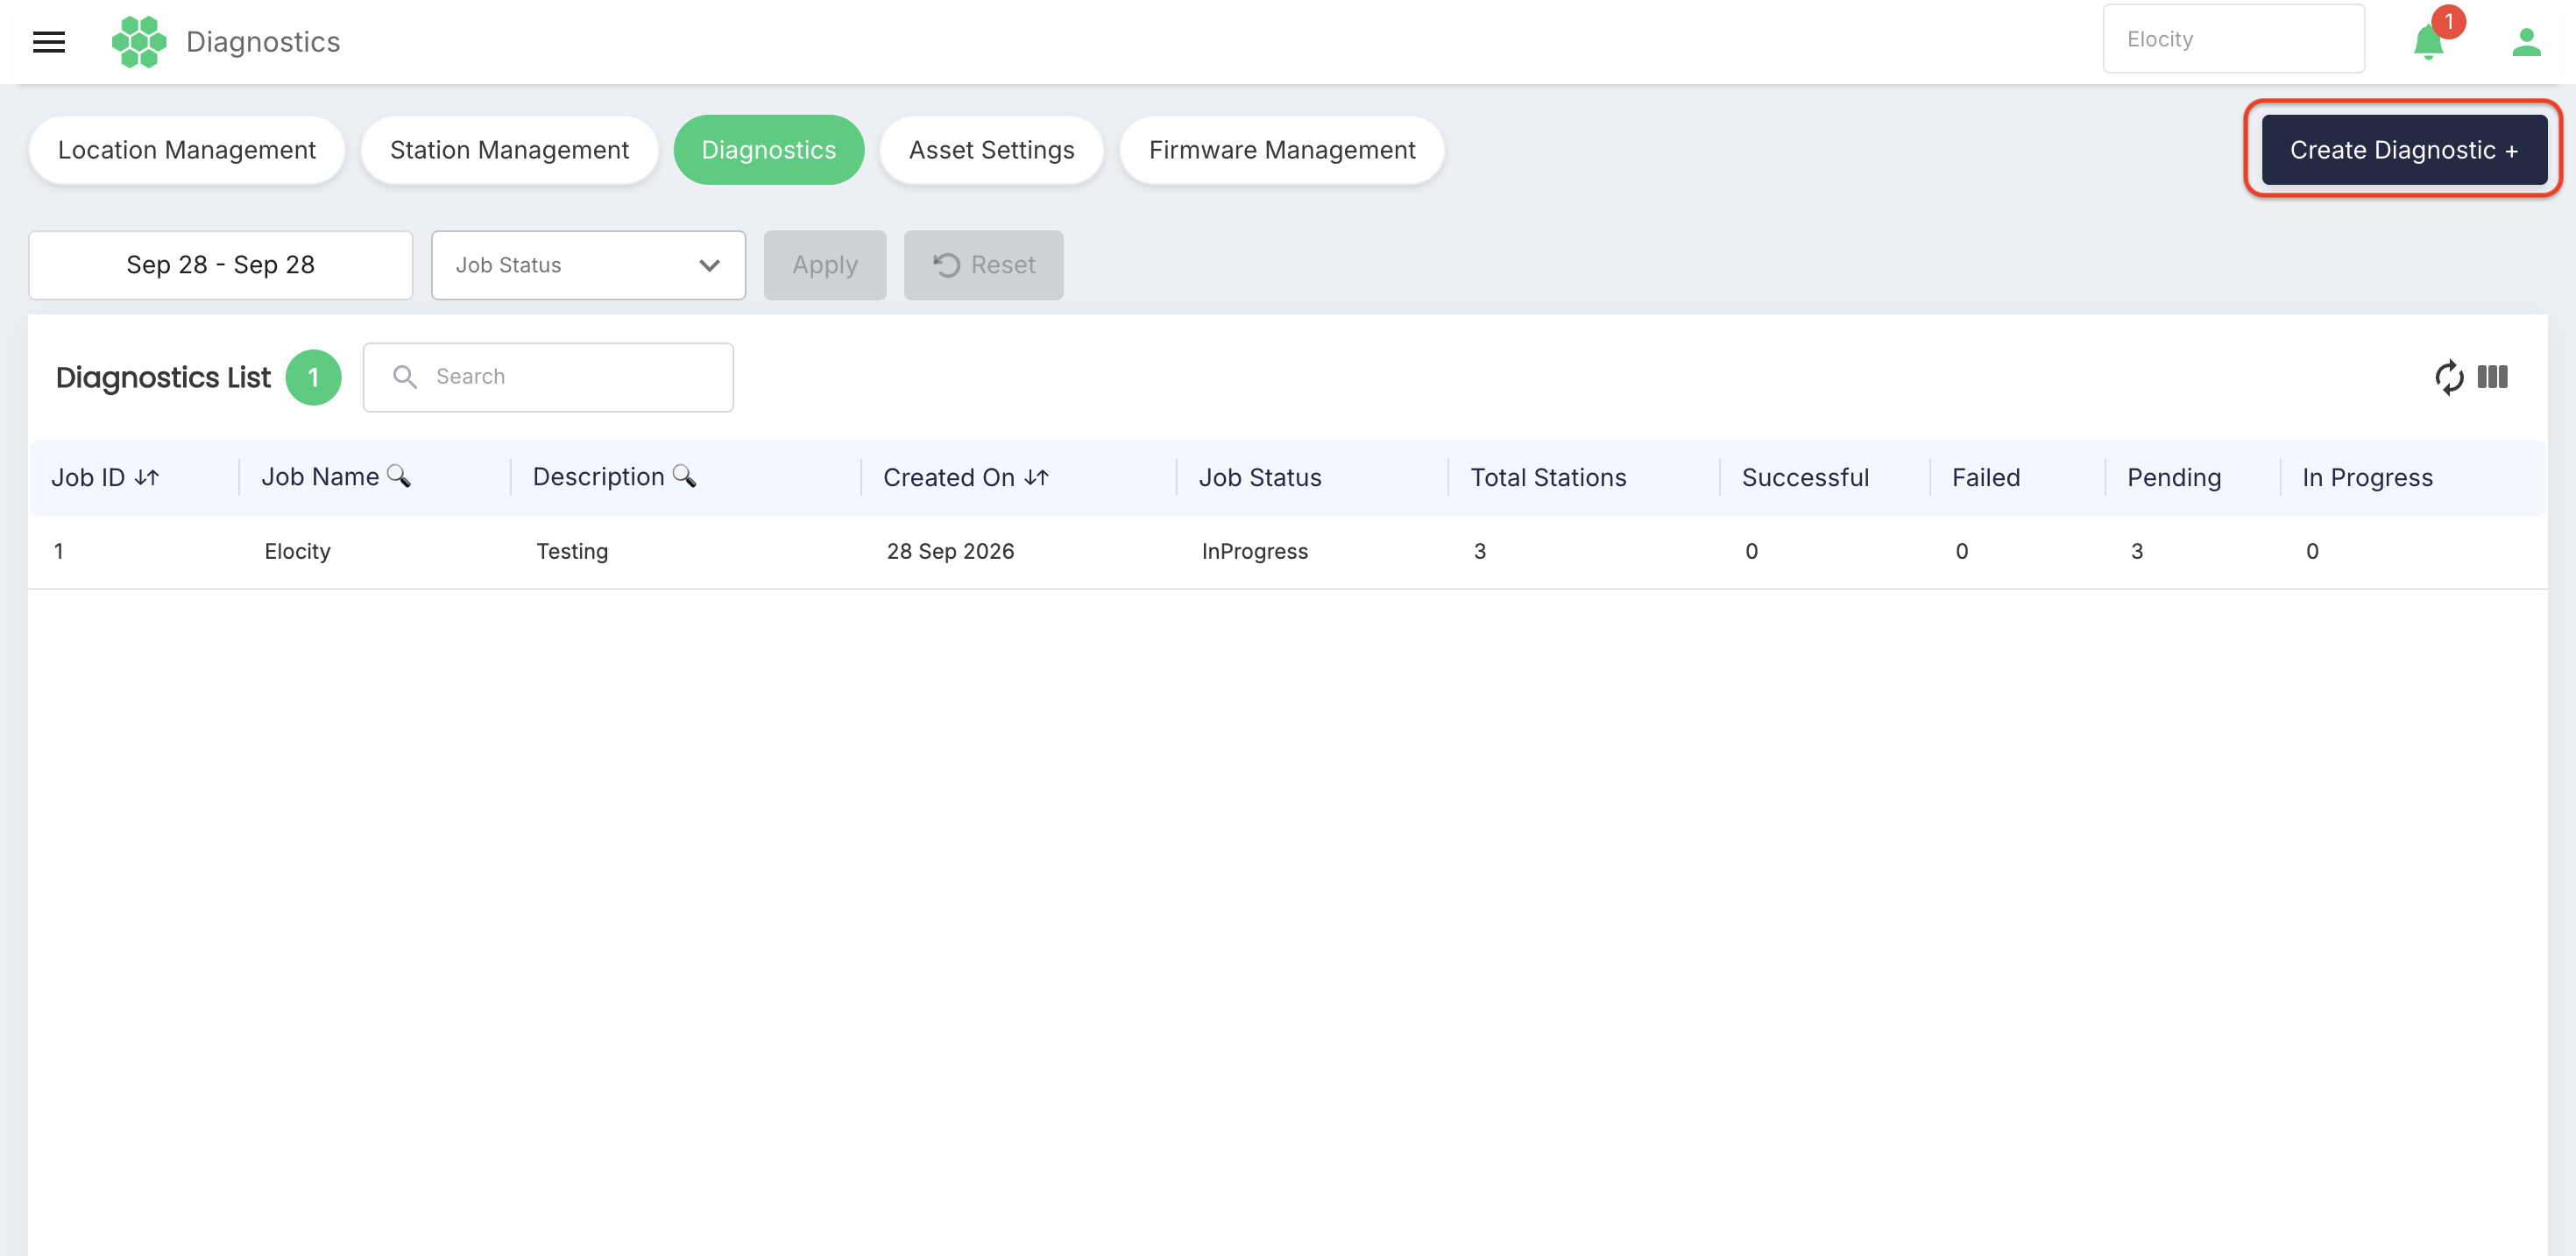
| Create Diagnostic + | Opens the creation form to configure and trigger a new diagnostic log collection job. |
Refresh (⟳) | Reloads the diagnostic jobs list with the latest real-time status from the server. |
| Column Filter | Opens the Show / Hide Columns drawer to customize table column visibility. |
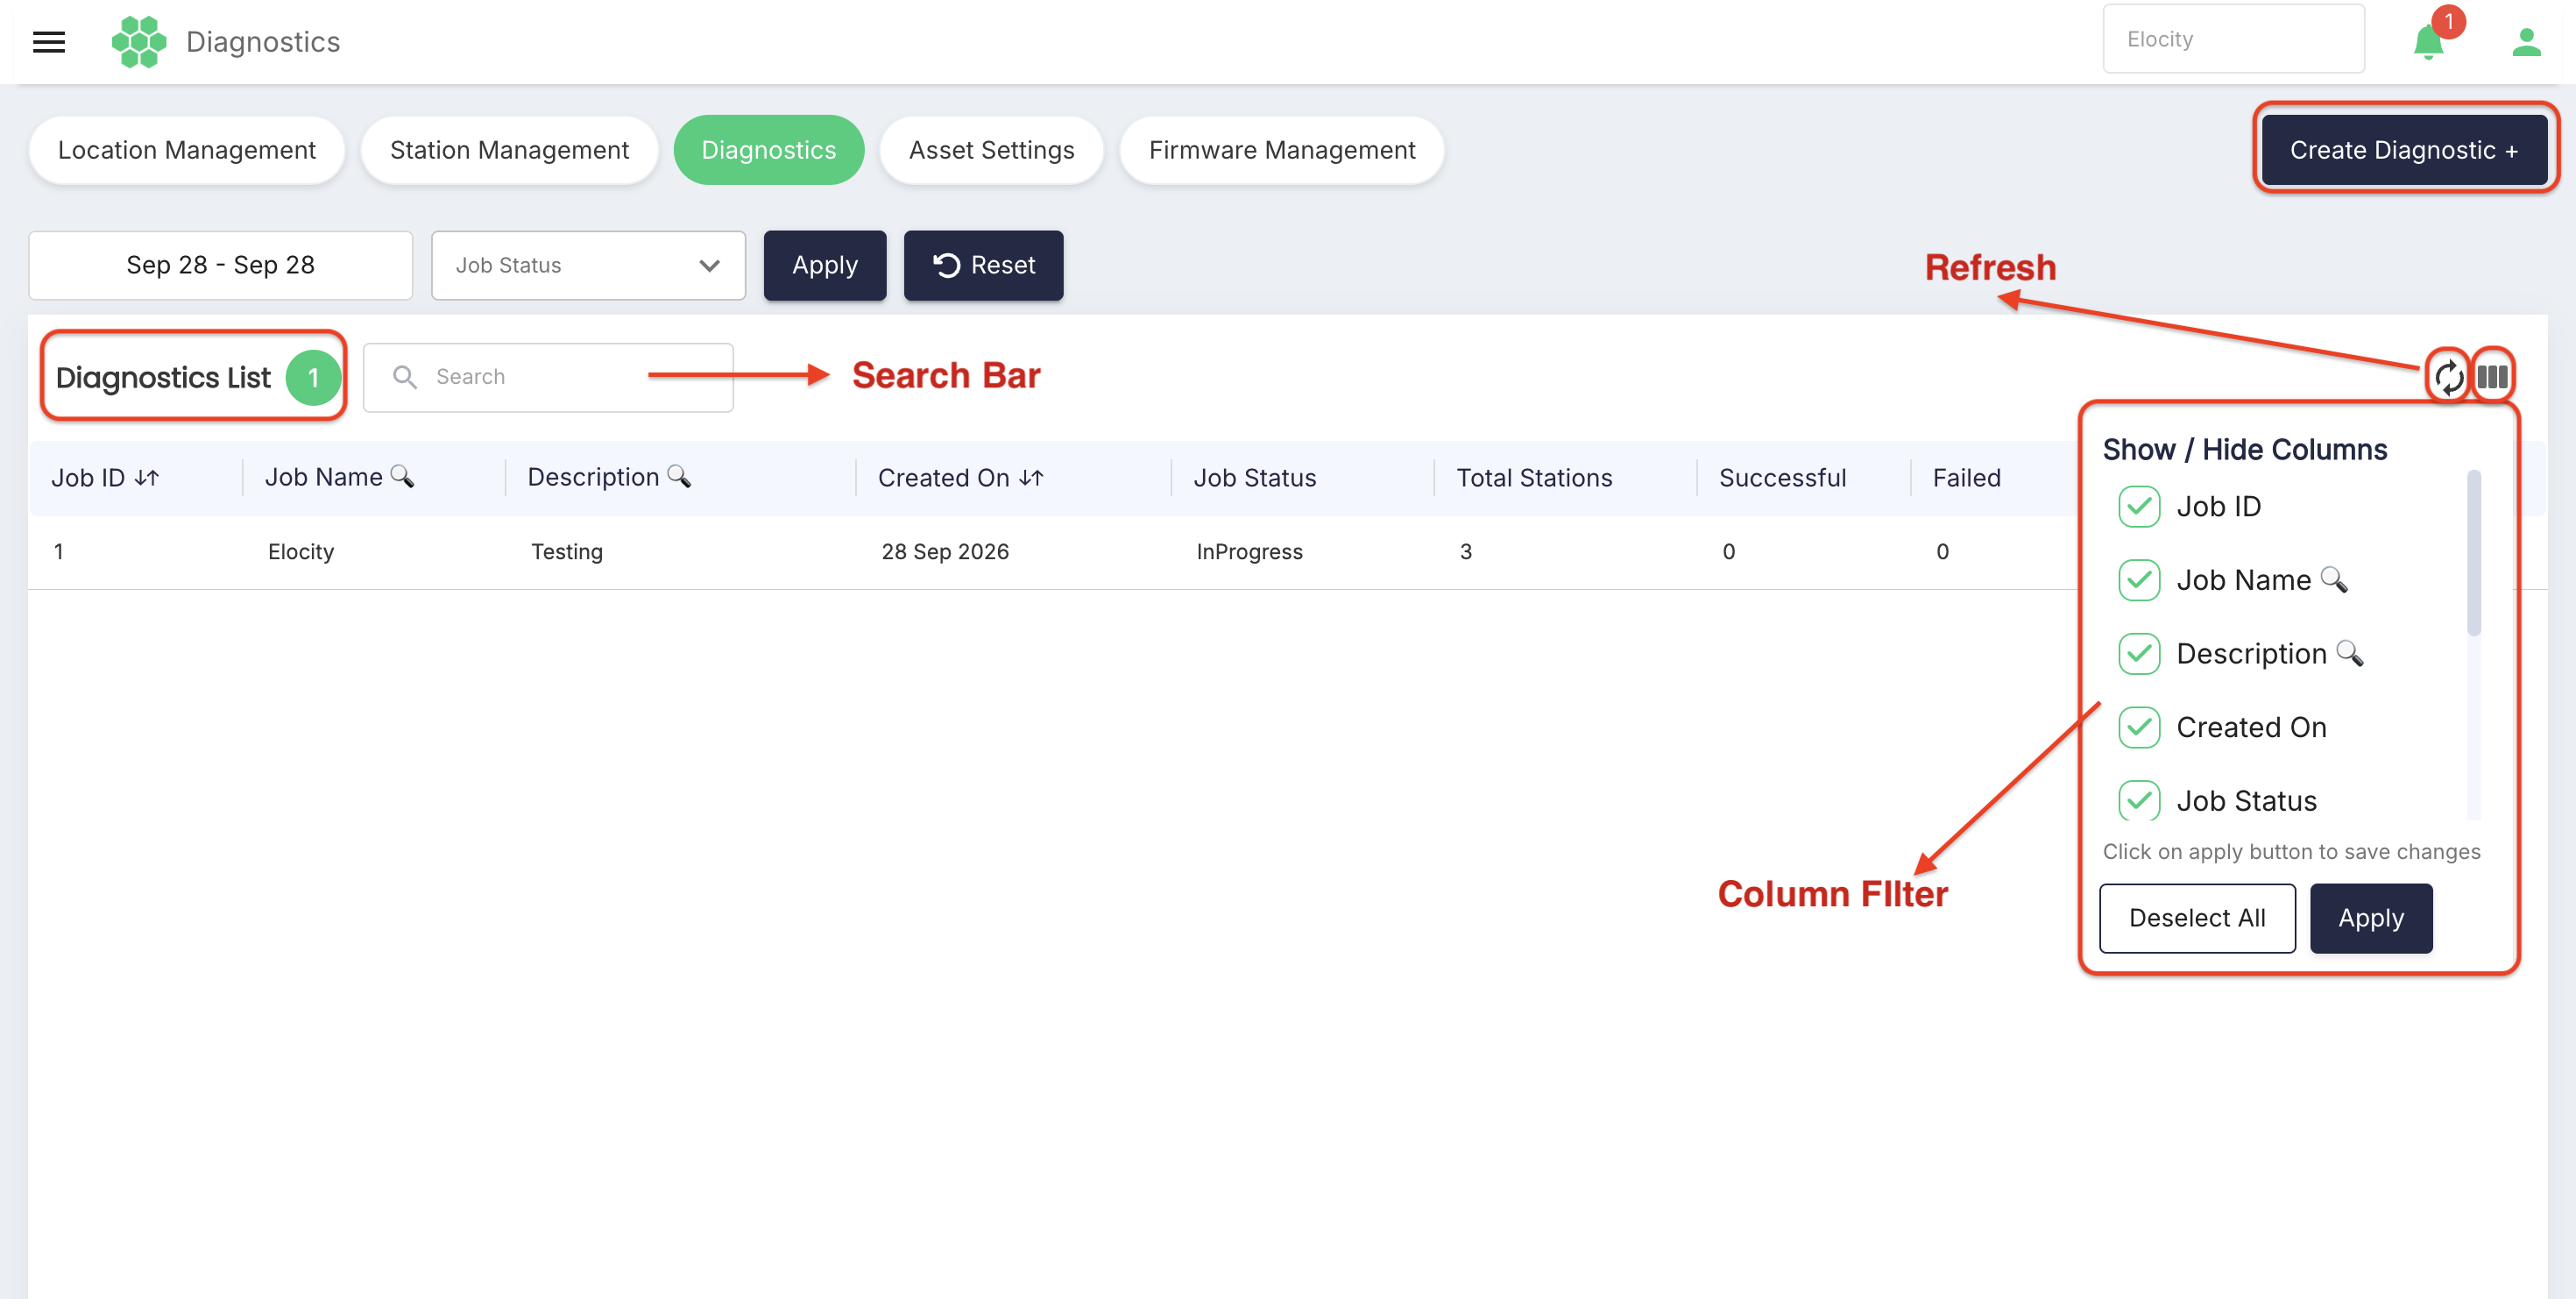
Show / Hide Columns
Select Column Filter (|||) to open the column selection menu:
- Check or uncheck individual column checkboxes:
Job IDJob Name 🔍Description 🔍Created OnJob StatusTotal StationsSuccessfulFailedPendingIn Progress
- Use Deselect All to clear all selections.
- Select Apply to save and apply the custom layout.
5. Diagnostics Register Columns
Each row in the register represents a diagnostic collection job:
| Column | Interaction | Description |
|---|---|---|
| Job ID | Sortable (↓↑) | System-generated unique identifier assigned to the diagnostic job (e.g., 1). Selecting the row or Job ID opens the Job Details view. |
| Job Name | Searchable (🔍) | User-defined title or reference label given to the job (e.g., Elocity). |
| Description | Searchable (🔍) | Purpose or troubleshooting context documented for the job (e.g., Testing). |
| Created On | Sortable (↓↑) | Date when the diagnostic task was submitted (e.g., 28 Sep 2026). |
| Job Status | Display Label | Overall execution status of the job (Pending, In Progress, Success, Failed, Partial Success, Dispatching). |
| Total Stations | Numeric Count | Total number of charging stations targeted by the diagnostic job (e.g., 3). |
| Successful | Numeric Count | Number of charging stations that successfully generated and uploaded diagnostic logs. |
| Failed | Numeric Count | Number of charging stations that failed to process or upload diagnostic logs. |
| Pending | Numeric Count | Number of charging stations where the diagnostic command is queued. |
| In Progress | Numeric Count | Number of charging stations currently generating or uploading diagnostic logs. |
6. Creating a Diagnostic Job
To configure and dispatch a new EVSE diagnostic request:
- Navigate to Assets > Diagnostics.
- Select Create Diagnostic + in the top-right corner.
- Complete the required form fields:
| Field | Requirement | Description |
|---|---|---|
| Name* | Required | Descriptive name for the diagnostic job (e.g., Site A - Log Investigation). |
| Description* | Required | Detailed troubleshooting reason or issue description. |
| Network* | Required | Dropdown hierarchy to select the target geographic site or location (displays No Location Selected by default). |
| Stations* | Required | Multi-select dropdown to choose one or more charging stations within the selected network. |
| Start Date/Time* | Required | The beginning timestamp of the historical log window to retrieve from the chargers. |
| Stop Date/Time* | Required | The ending timestamp of the historical log window to retrieve from the chargers. |
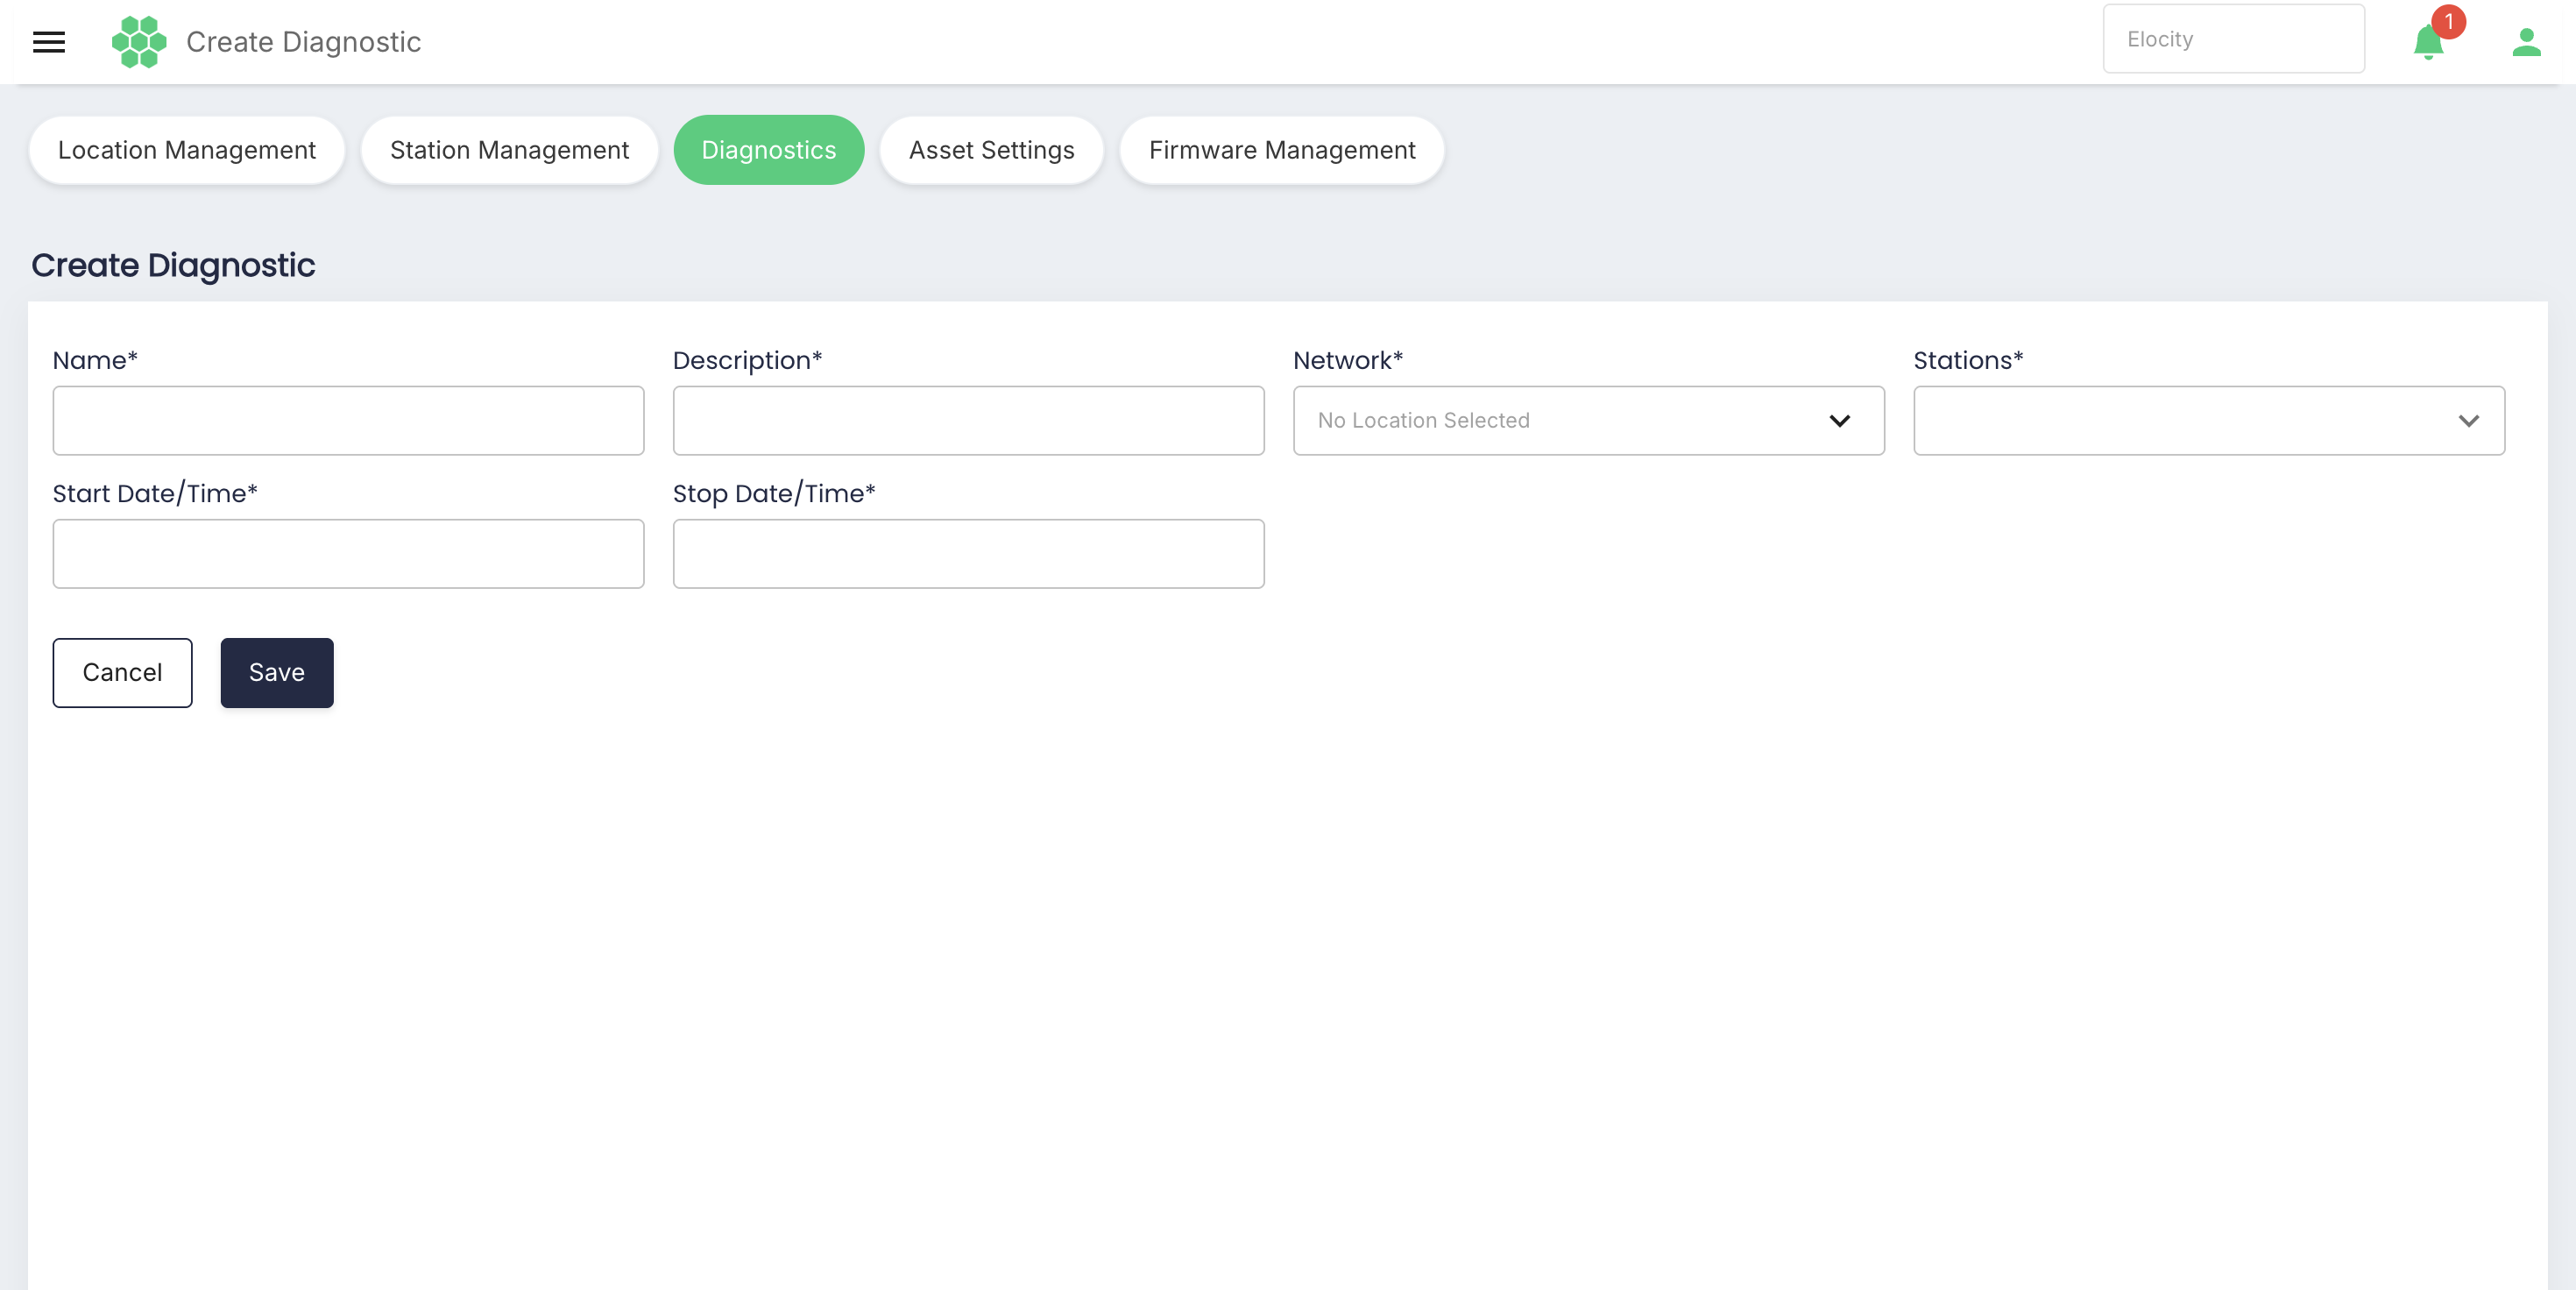
- Select Save to dispatch the diagnostic command to the selected charging stations.
- Select Cancel to discard the form without creating a job.
7. Viewing Job Details & Downloading Logs (< Job ID: [n])
To inspect individual station status and download collected log files:
- In the Diagnostics List, locate and select the desired diagnostic job row.
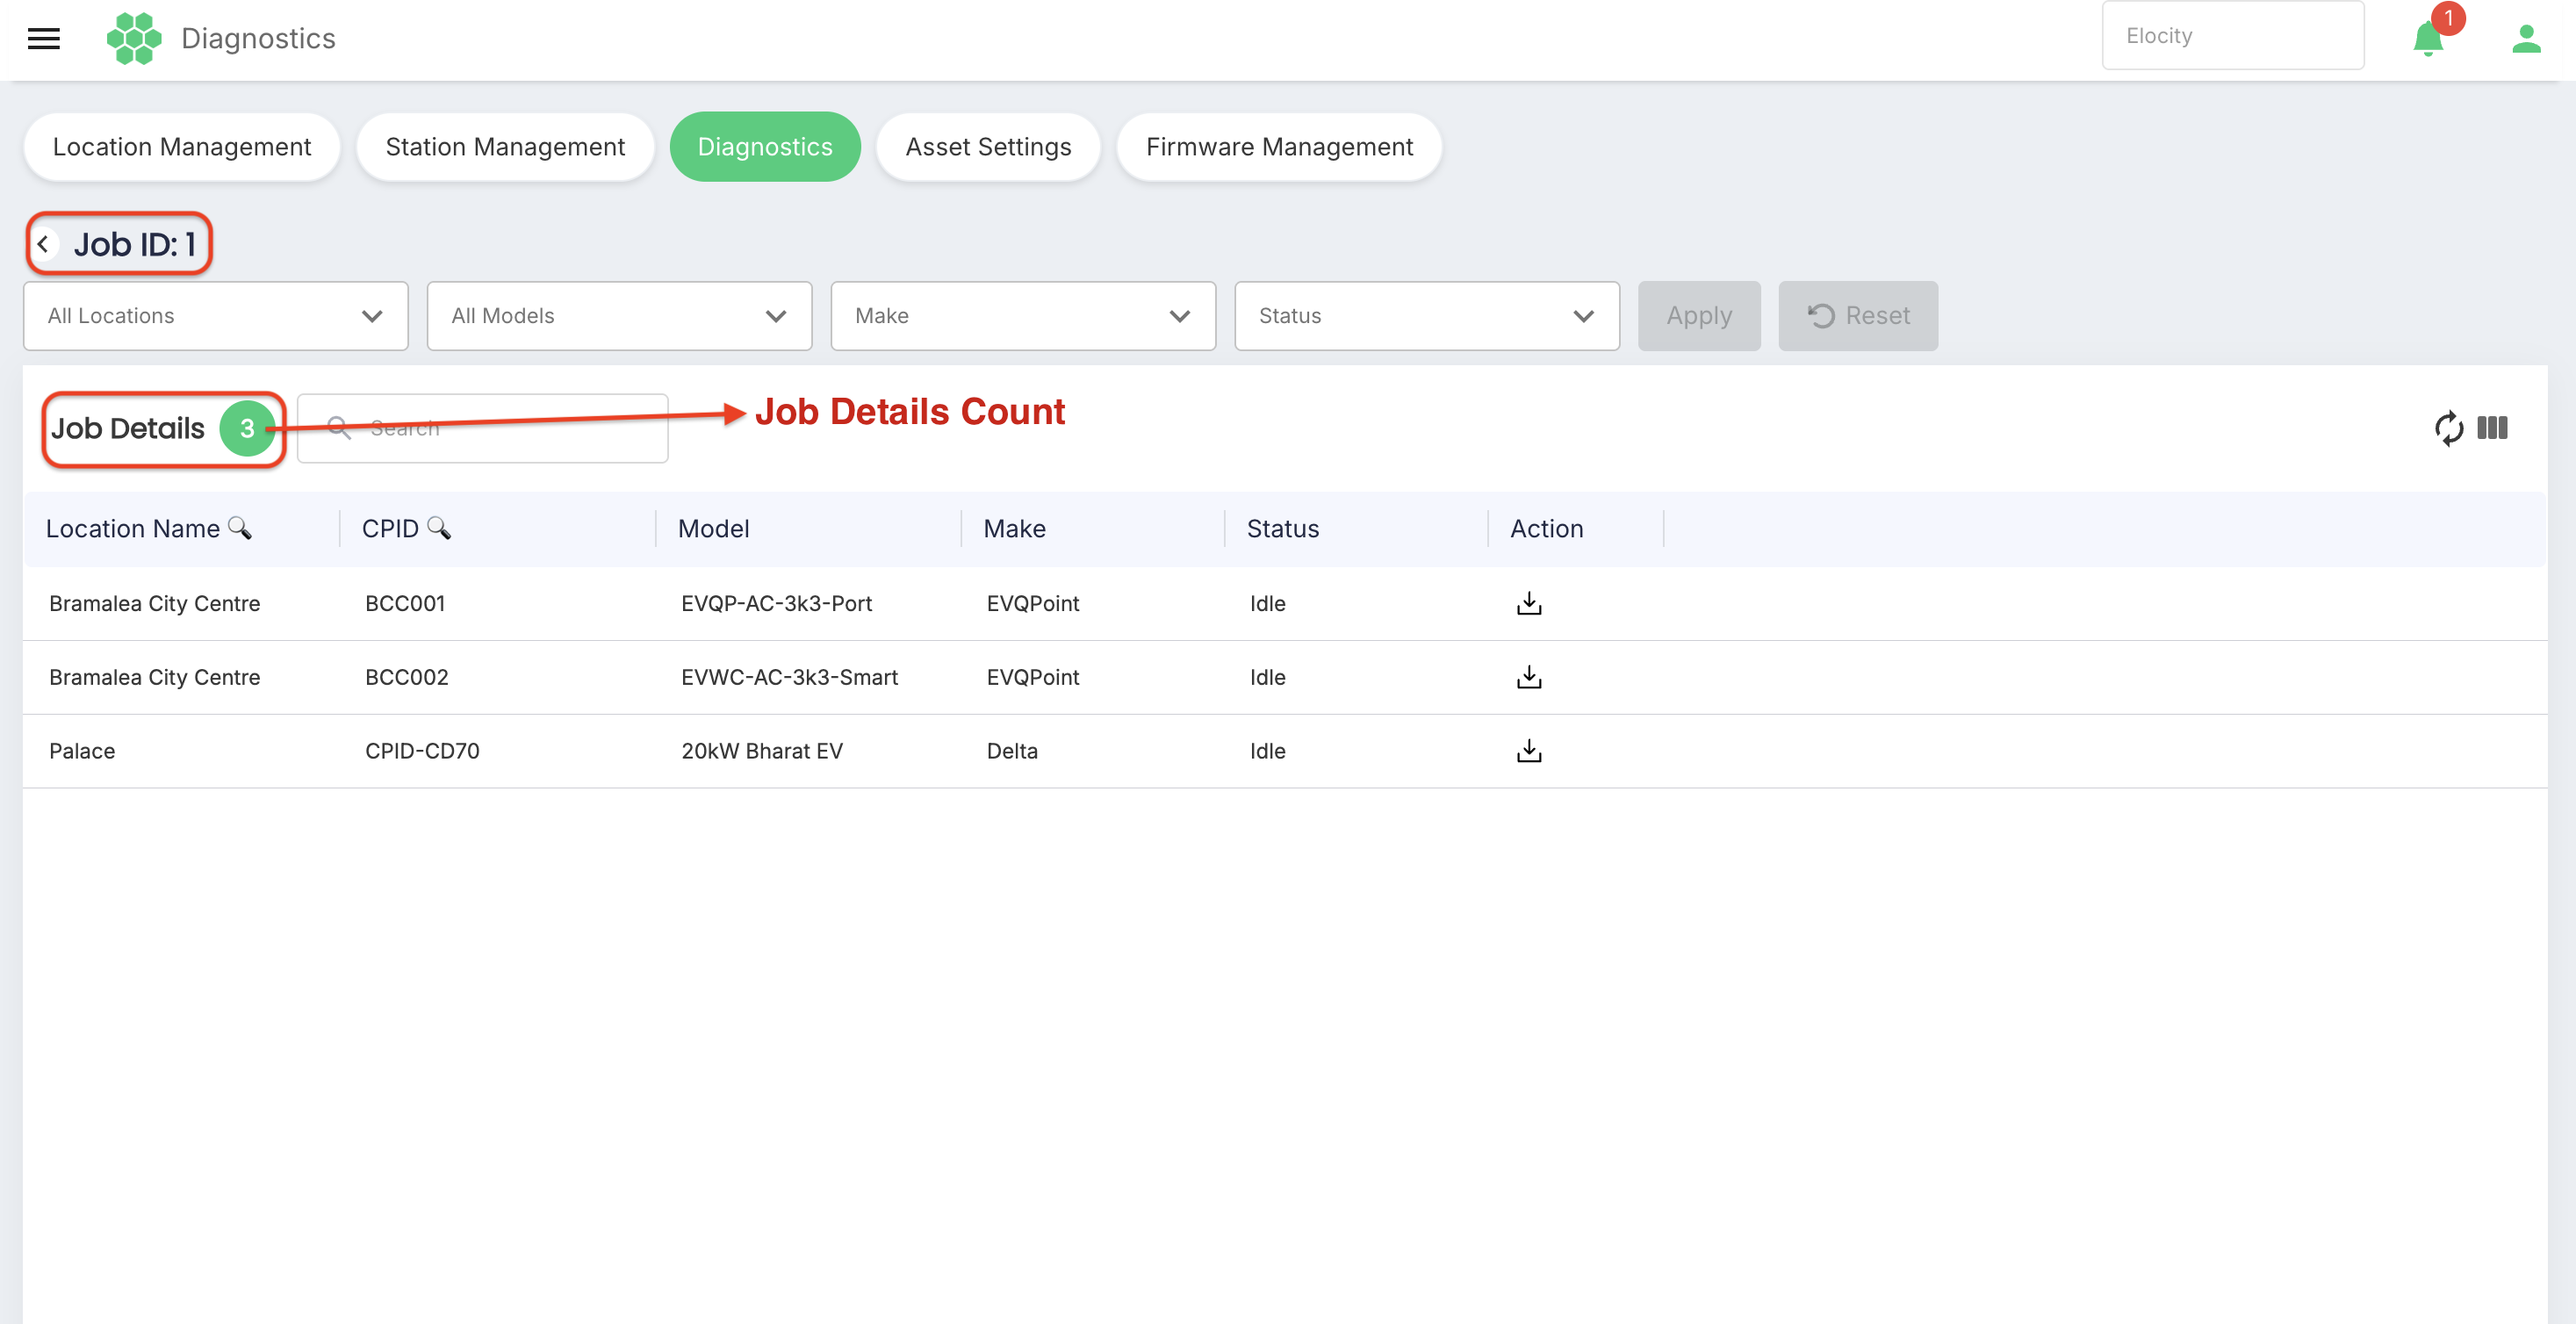
- The portal opens the Job Details page:
Navigation & Header
< Back Arrow: Located beside the Job ID (e.g.,< Job ID: 1), returns directly to the main Diagnostics list.- Job Details Count Badge: Displays the number of target stations in the job (e.g.,
Job Details 3).
Job Details Filter Bar
The page provides station-level filters to narrow down large multi-station jobs:
All Locations ⌵— Filters stations by charging location.All Models ⌵— Filters stations by EVSE hardware model.Make ⌵— Filters stations by manufacturer.Status ⌵— Filters stations by individual log status (Idle,In Progress,Uploaded,Failed).Apply&Reset— Executes or resets station filter criteria.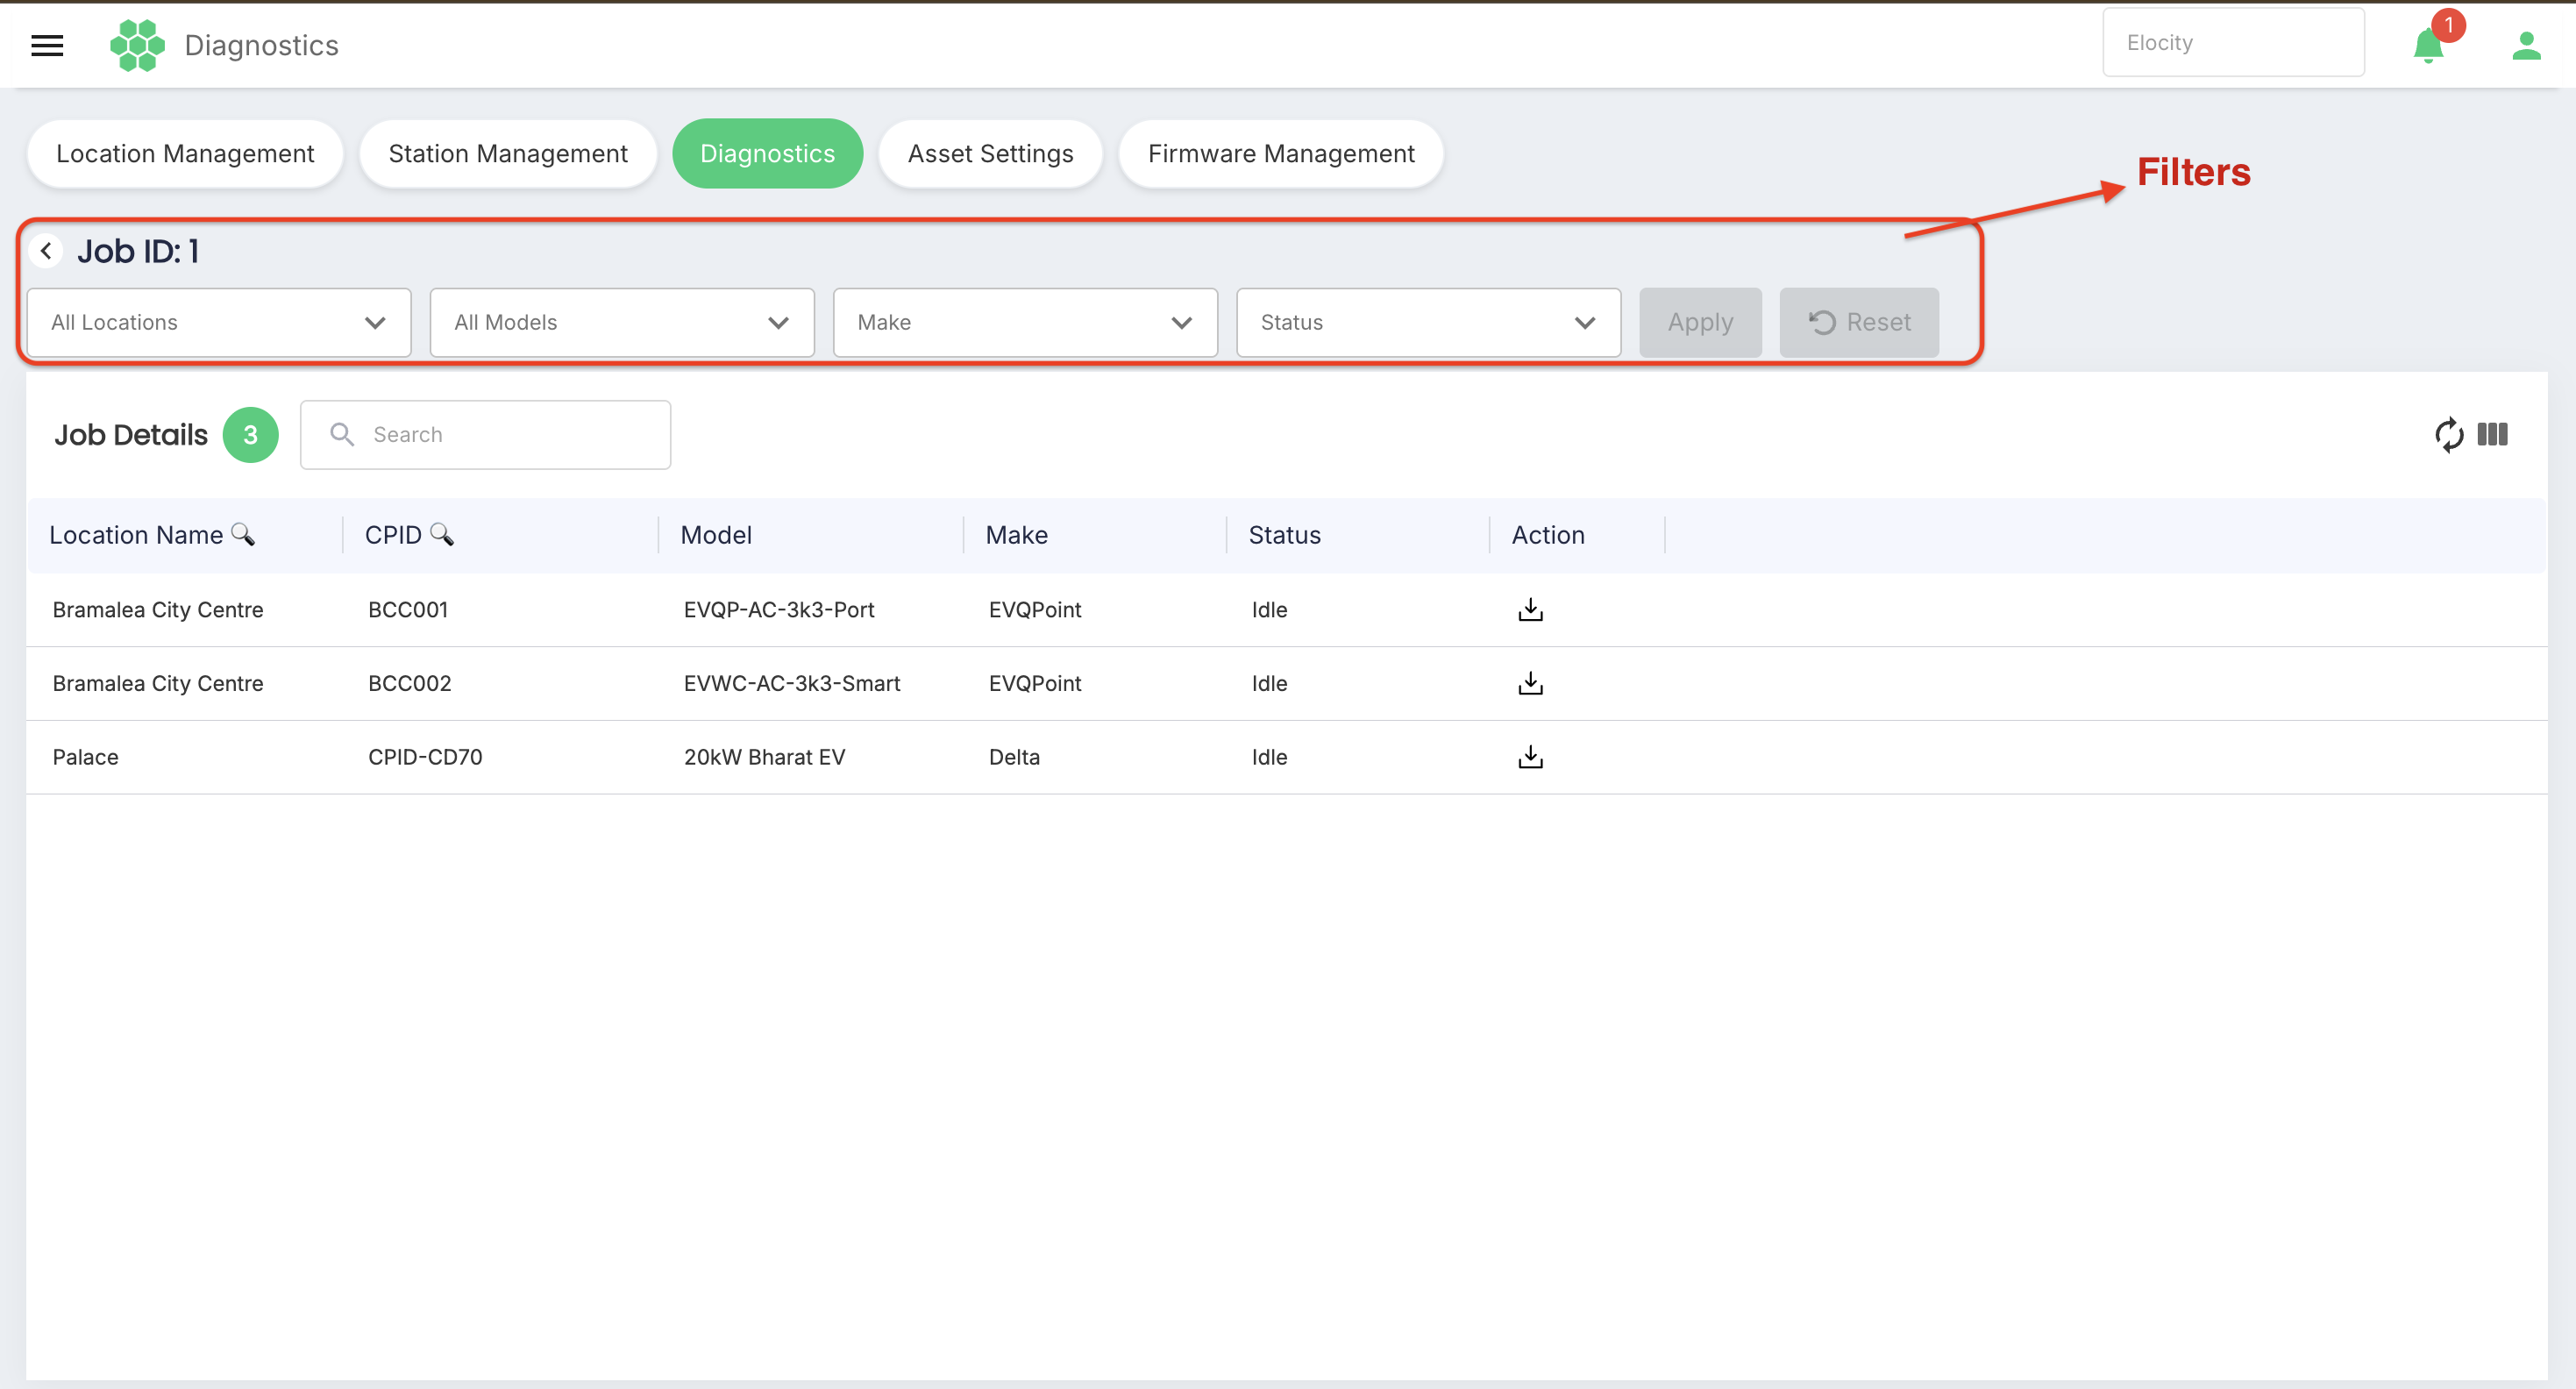
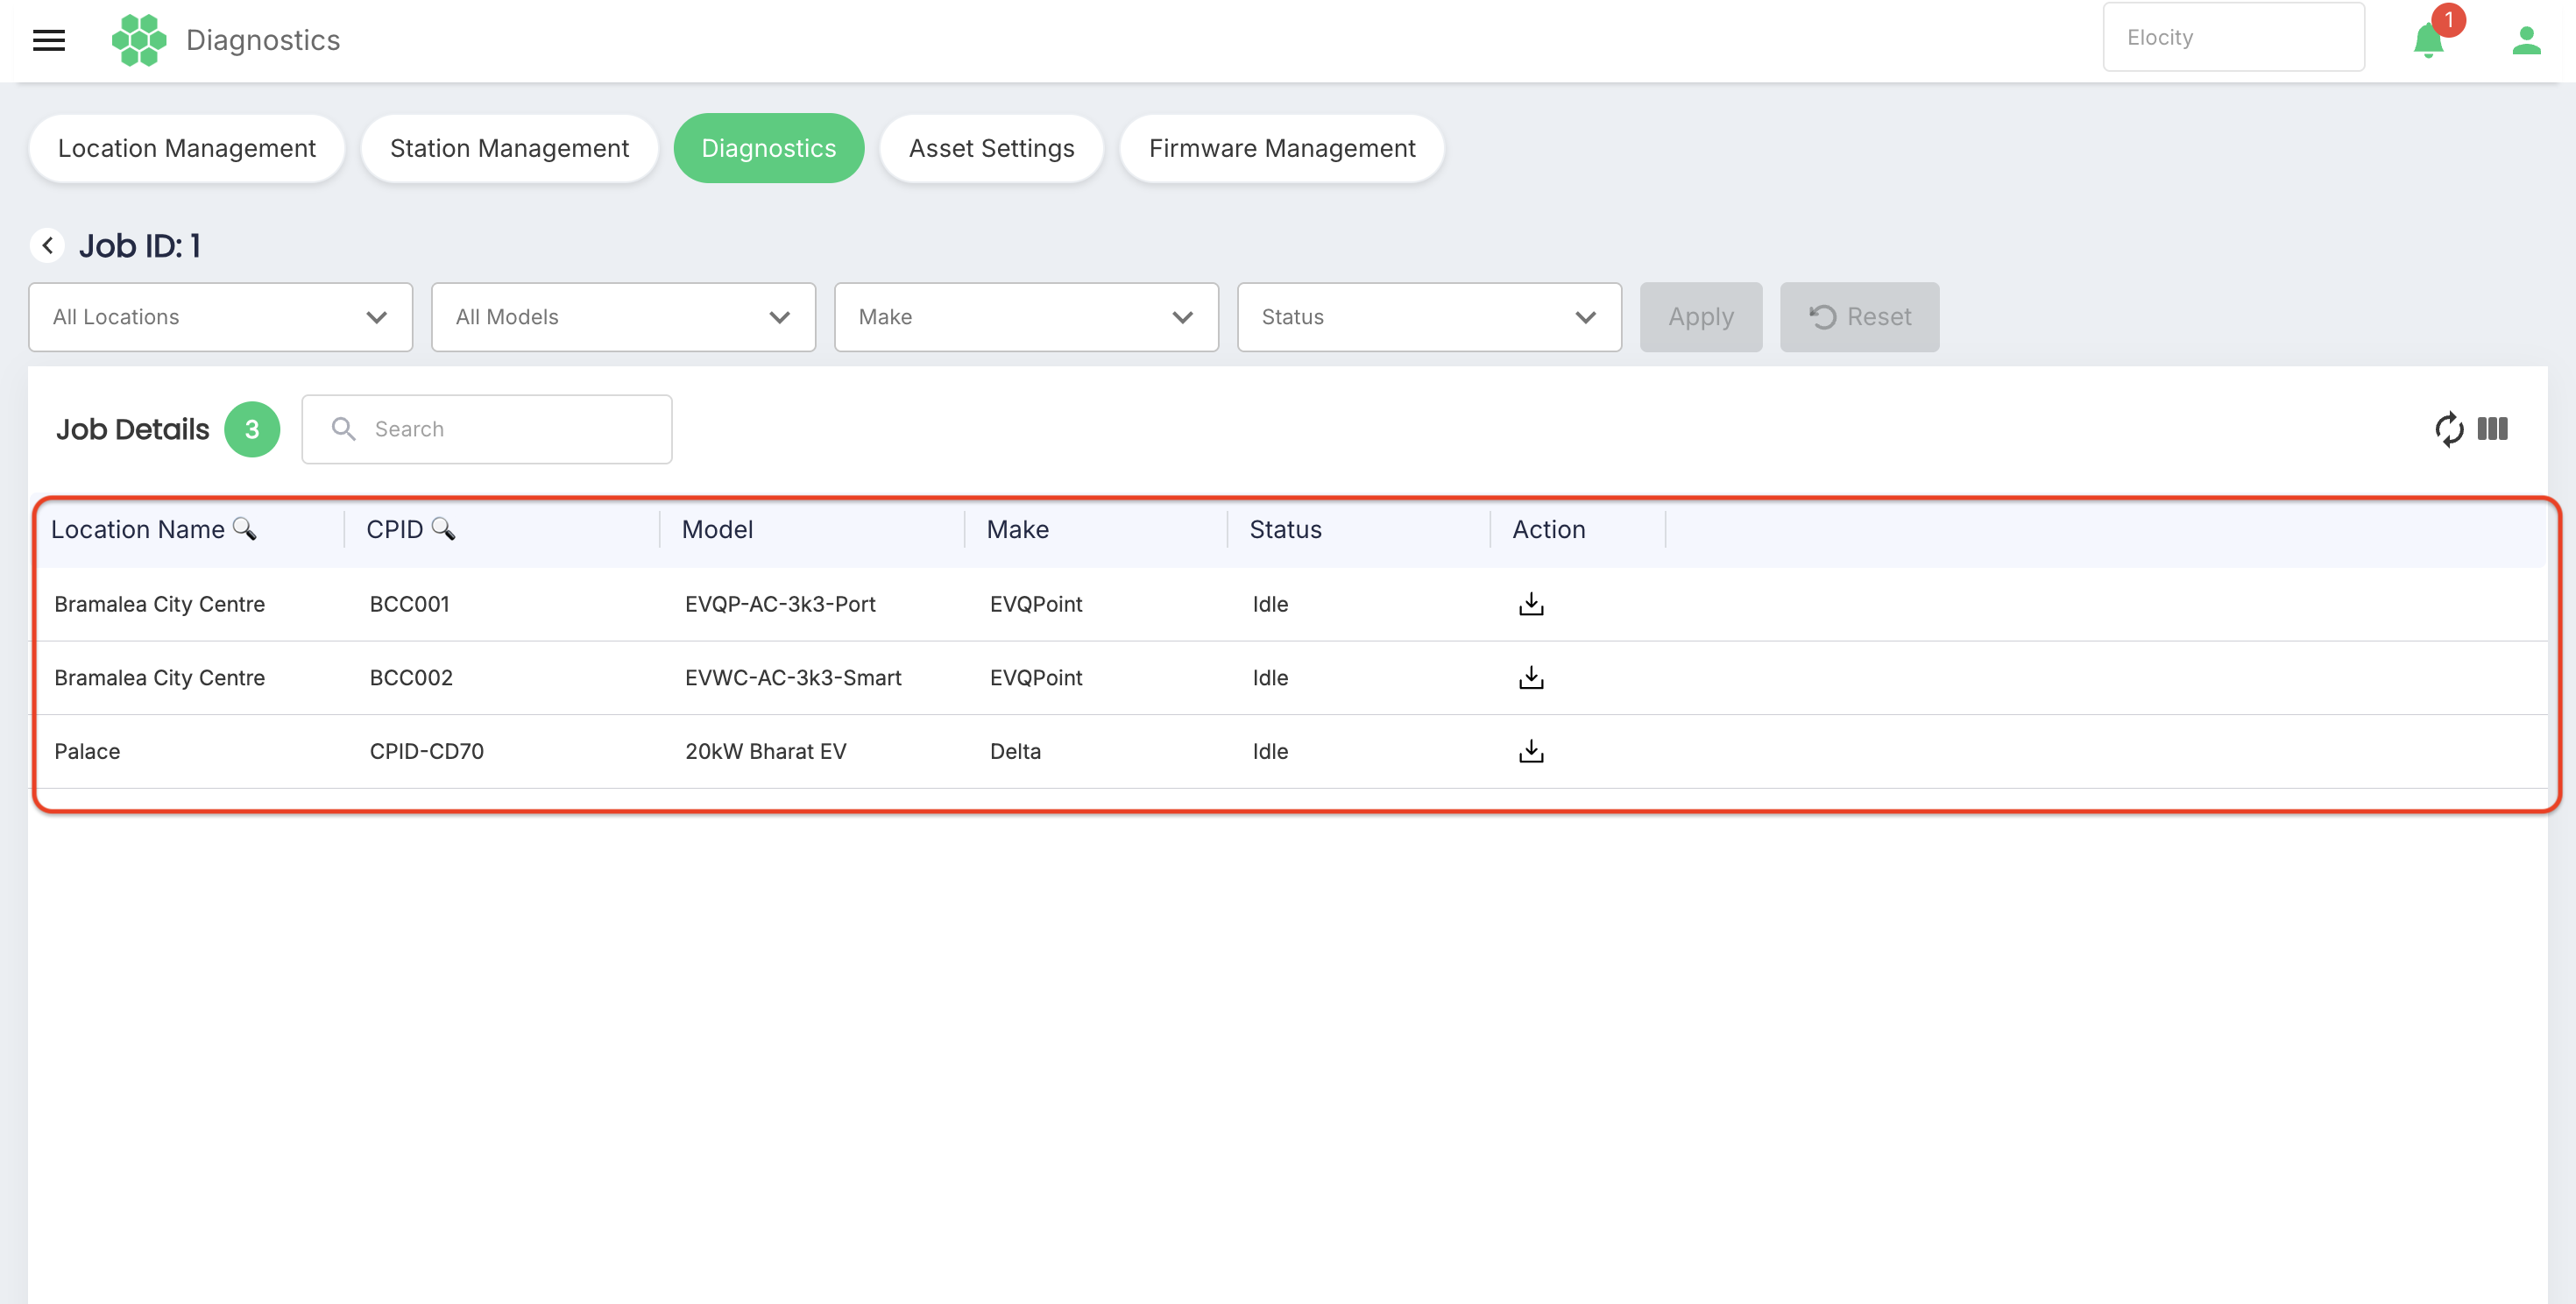
Target Stations Table
| Column | Interaction | Description |
|---|---|---|
| Location Name | Searchable (🔍) | Name of the site where the charging station is installed (e.g., Bramalea City Centre, Palace). |
| CPID | Searchable (🔍) | Unique Charge Point Identifier (e.g., BCC001, BCC002, CPID-CD70). |
| Model | Display Text | Charger hardware model (e.g., EVQP-AC-3k3-Port, EVWC-AC-3k3-Smart, 20kW Bharat EV). |
| Make | Display Text | Station manufacturer (e.g., EVQPoint, Delta). |
| Status | Display Text | Station-level diagnostic log status (e.g., Idle, In Progress, Uploaded, Failed). |
| Action | Action Button | Contains the Download (📥) button to download the station's diagnostic archive file (.zip / .tar.gz / .log) to your local machine once available. |
8. Recommended Troubleshooting Workflow
- Identify Incident Window: Note the exact date and time when an EV driver or operator experienced an issue at a charging station.
- Create Diagnostic Task: Open Diagnostics > Create Diagnostic +, enter a descriptive title, select the affected network/stations, and specify the log window spanning at least 30 minutes before and after the incident.
- Dispatch & Monitor: Click Save. Monitor the Diagnostics List table as the status transitions from
Pending→In Progress→Success. - Open Job Details: Click the job row to open the station roster.
- Download & Analyze Logs: Click the Download (
📥) icon on the station row to download the raw technical logs for offline debugging or vendor escalation.