Reporting
The Reports section is a powerful tool that offers you detailed graphical representations across various parameters, facilitating effective management. You can utilize a range of predefined filters and reports.
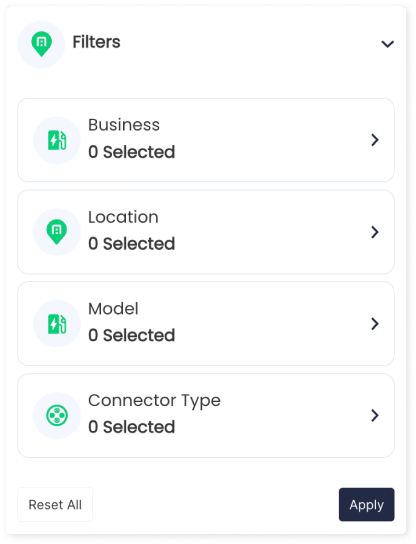
Filters
The filters section in the reporting module allows users to refine their reports, enabling a more focused analysis of charging infrastructure performance. These filters provide the flexibility to pinpoint specific aspects and gather insights tailored to criteria.
- Business: Filter reports based on specific business, allowing users to analyse performance metrics for separate business entities.
- Location: Narrow down reports to specific location, providing a location-based charging activity and performance.
- Model: Categorize reports by charging station models.
- Connector type: Filter reports based on the types of connectors used.
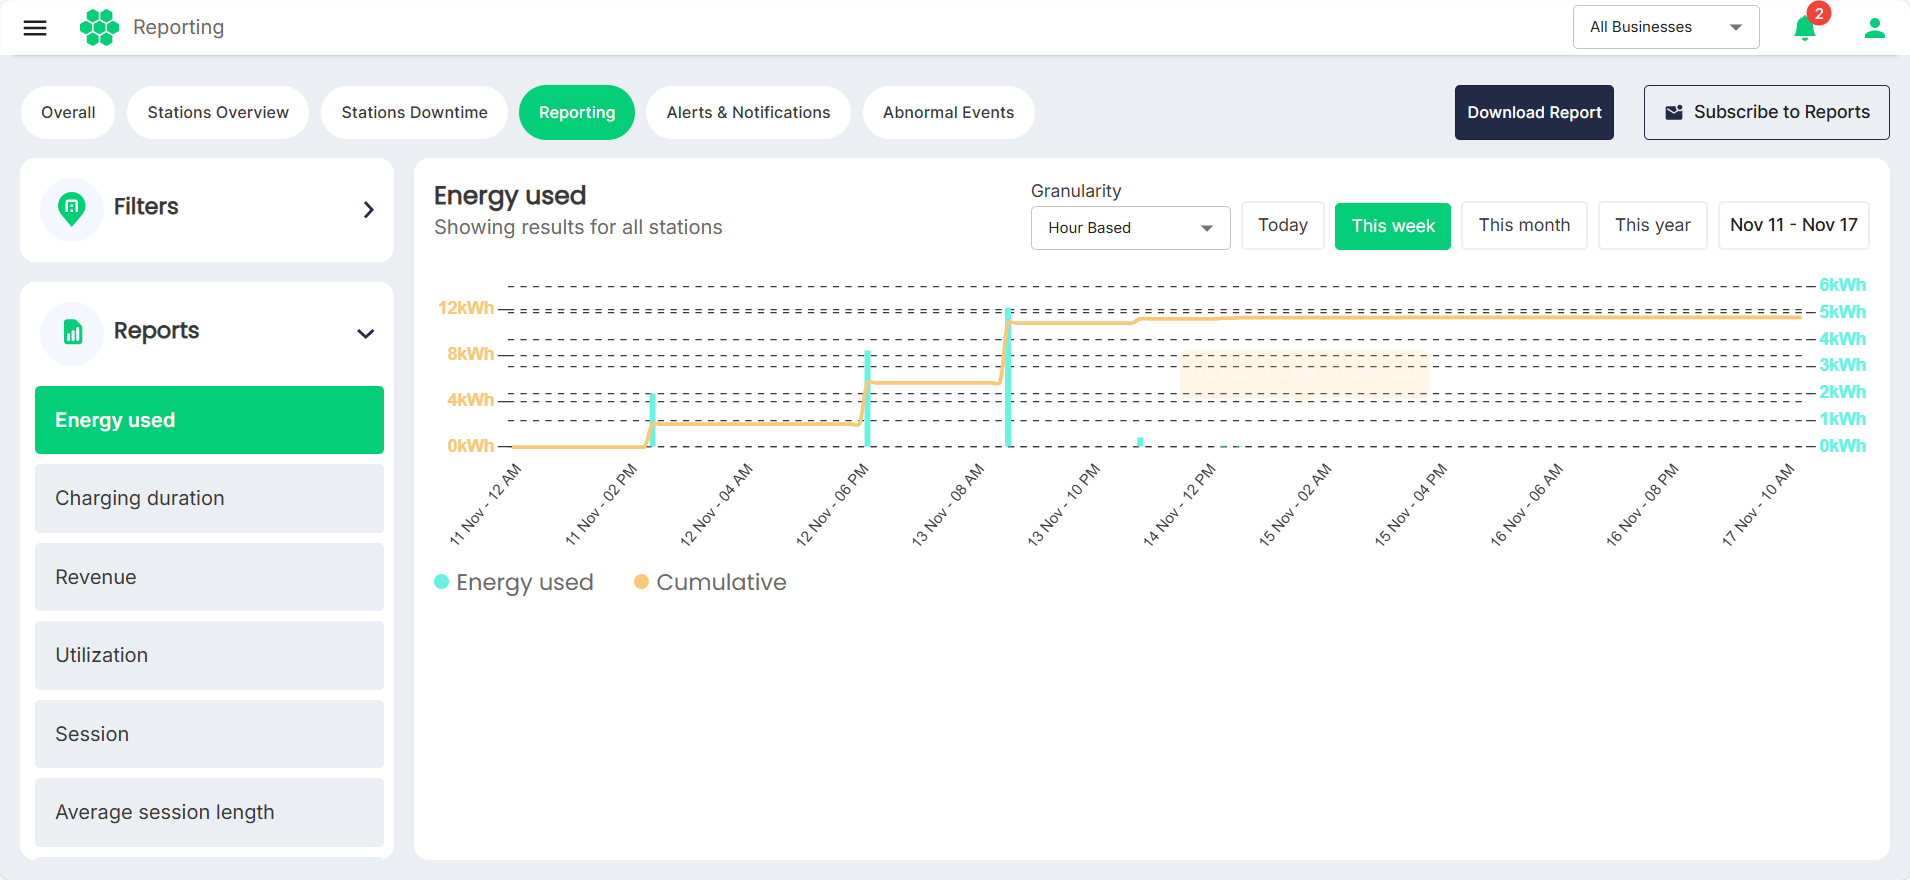
Reports
You can use preset and custom time filters, allowing for a more precise narrowing down of the results.
- Energy used
- Charging duration
- Revenue
- Utilization
- Session
- Average session length
- Connector faults
- Connector faults duration
- Peak hours
- Station outages
- Station outages duration
- Power users by revenue
- Power users by energy
- Revenue Vs Discounts
- Revenue Vs Sessions
- Revenue Vs Charging duration
- Utilization Vs Outages Vs Total availability
- Station availability
- Unique drivers
- Station lifetime histogram
- Power
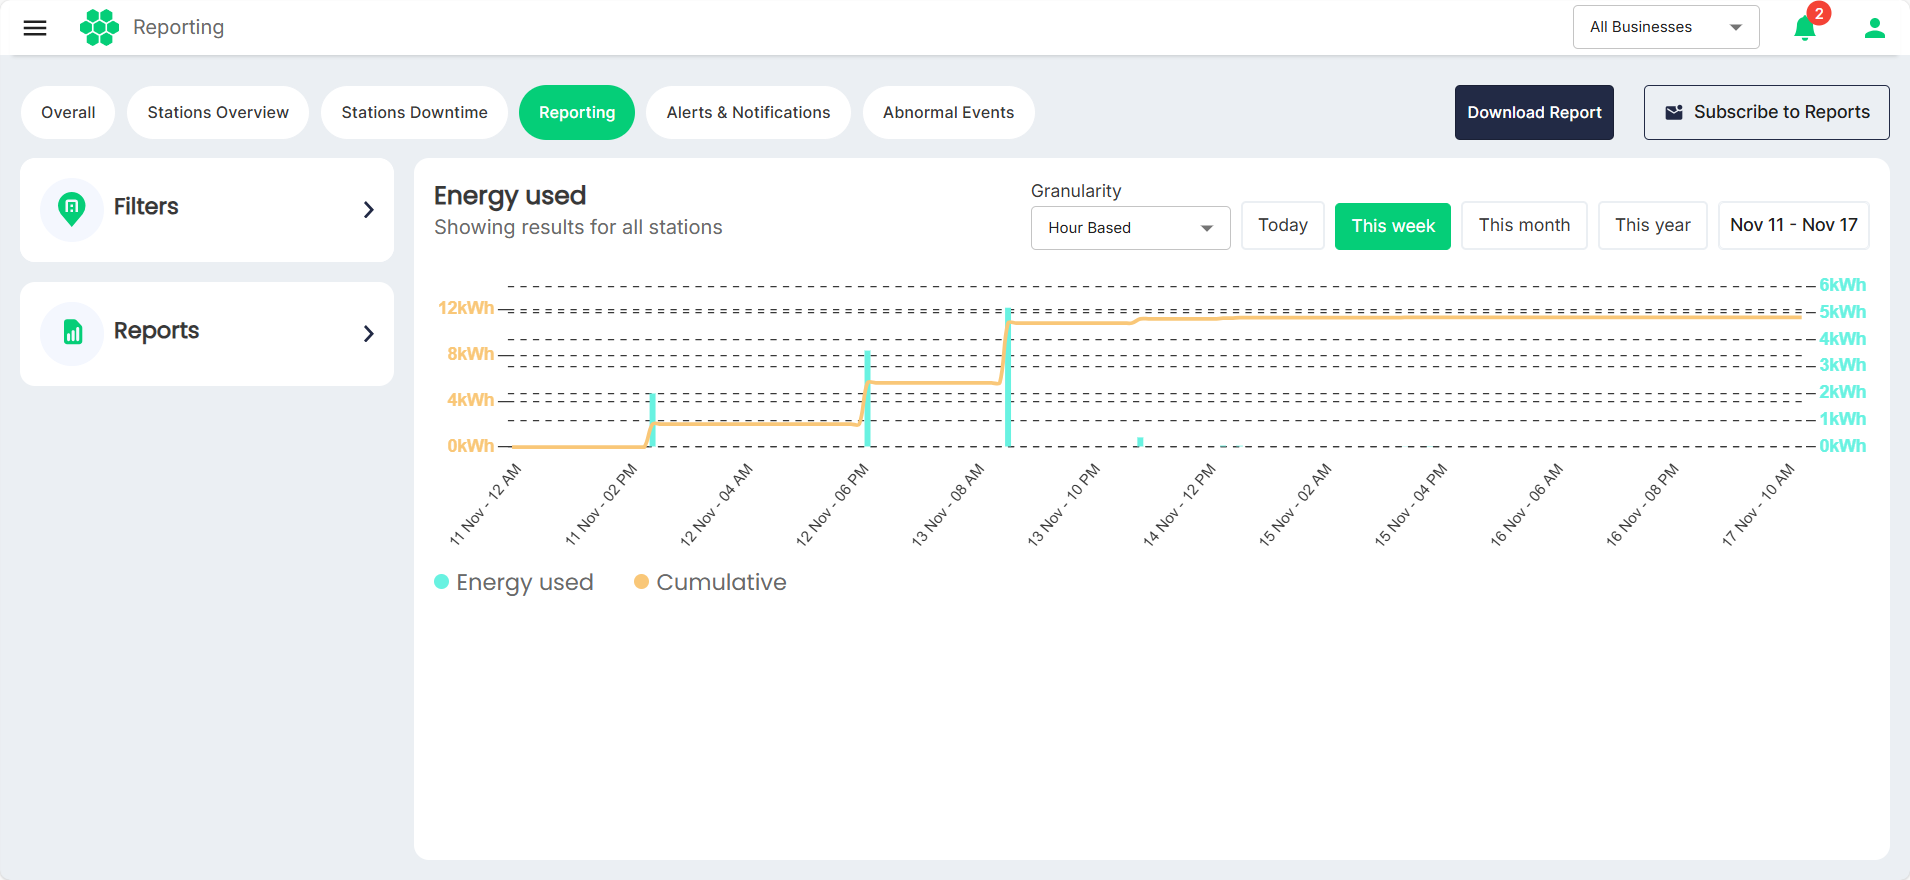
Energy used
This report offers a graphical representation of energy consumption over different periods. You can identify peak consumption days, assess efficiency, and plan for optimal energy management.
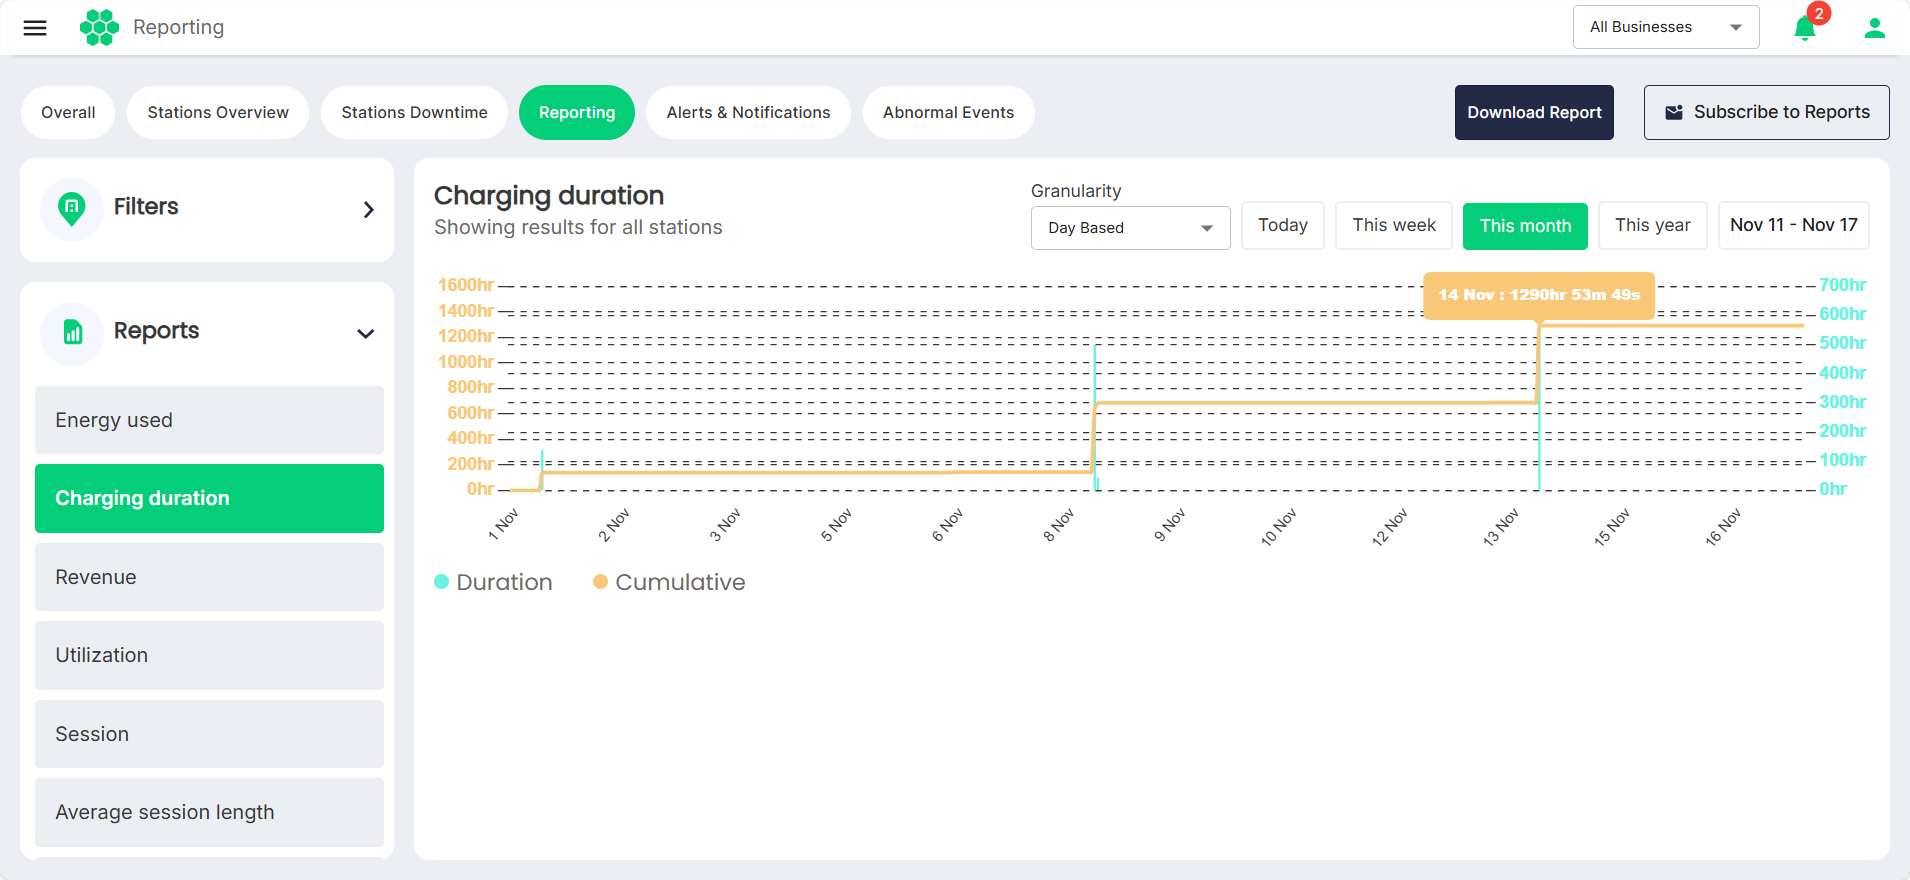
Charging duration
This report enables the visualization of the cumulative duration of charging sessions at your business/location.
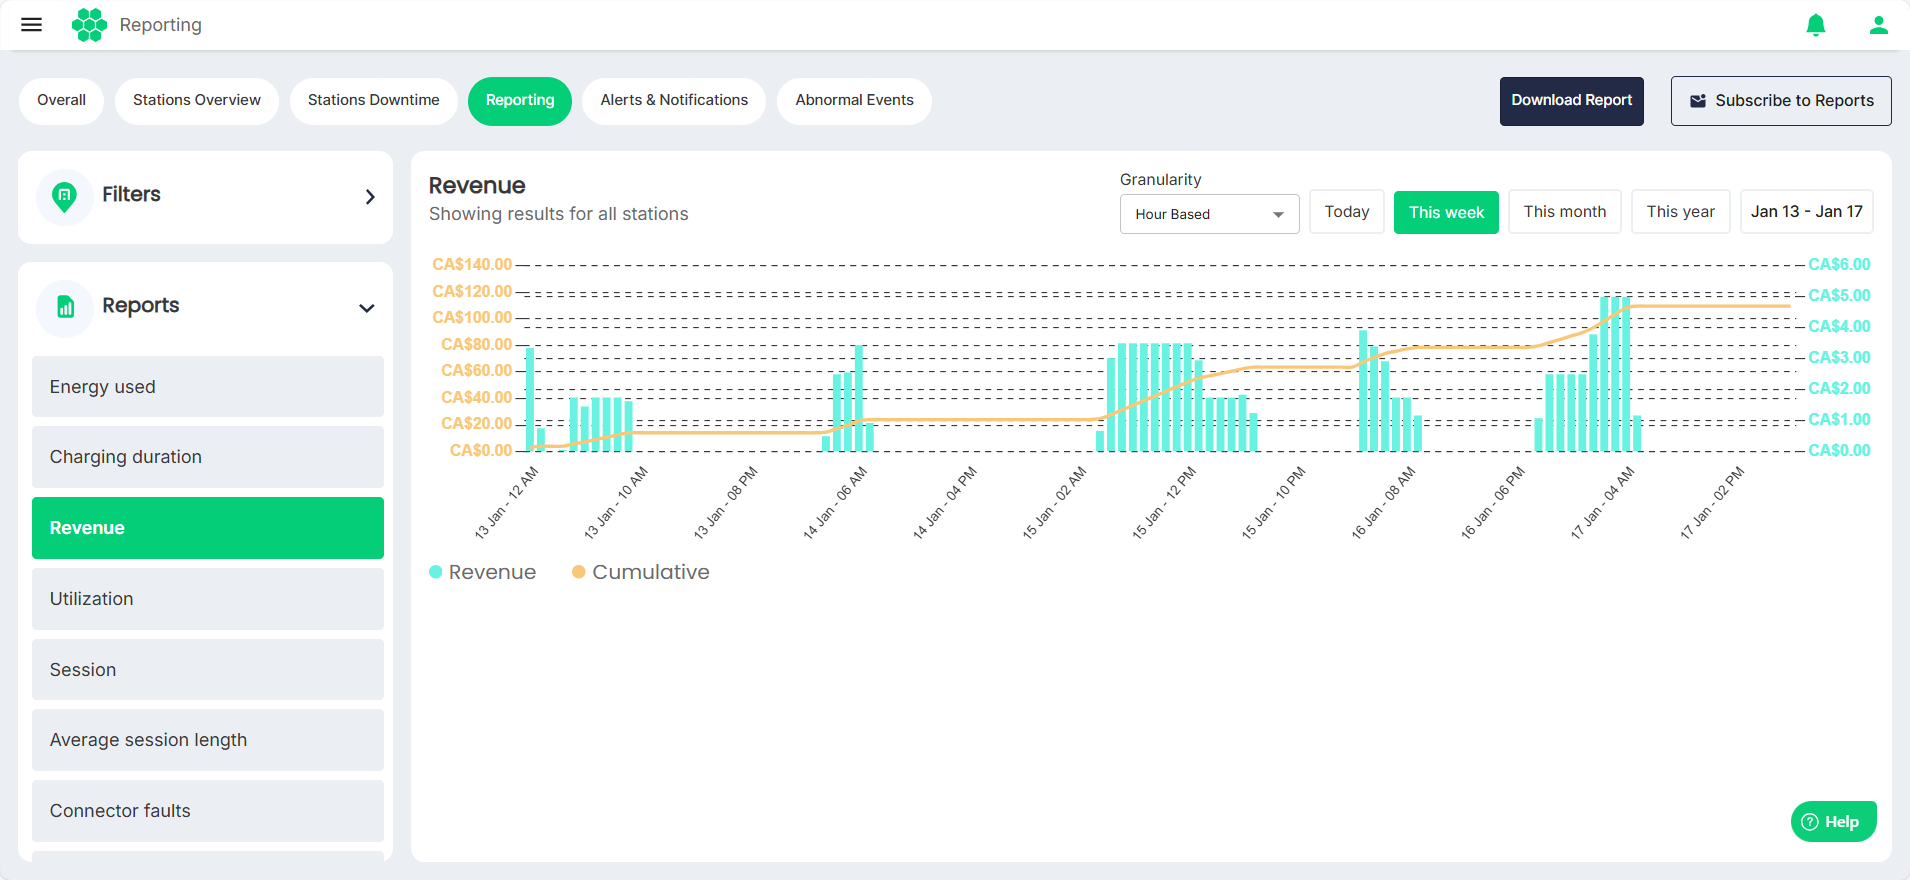
Revenue
Financial transactions generated from charging sessions are detailed in this report. It aids in revenue analysis, financial planning, and strategic decision-making.
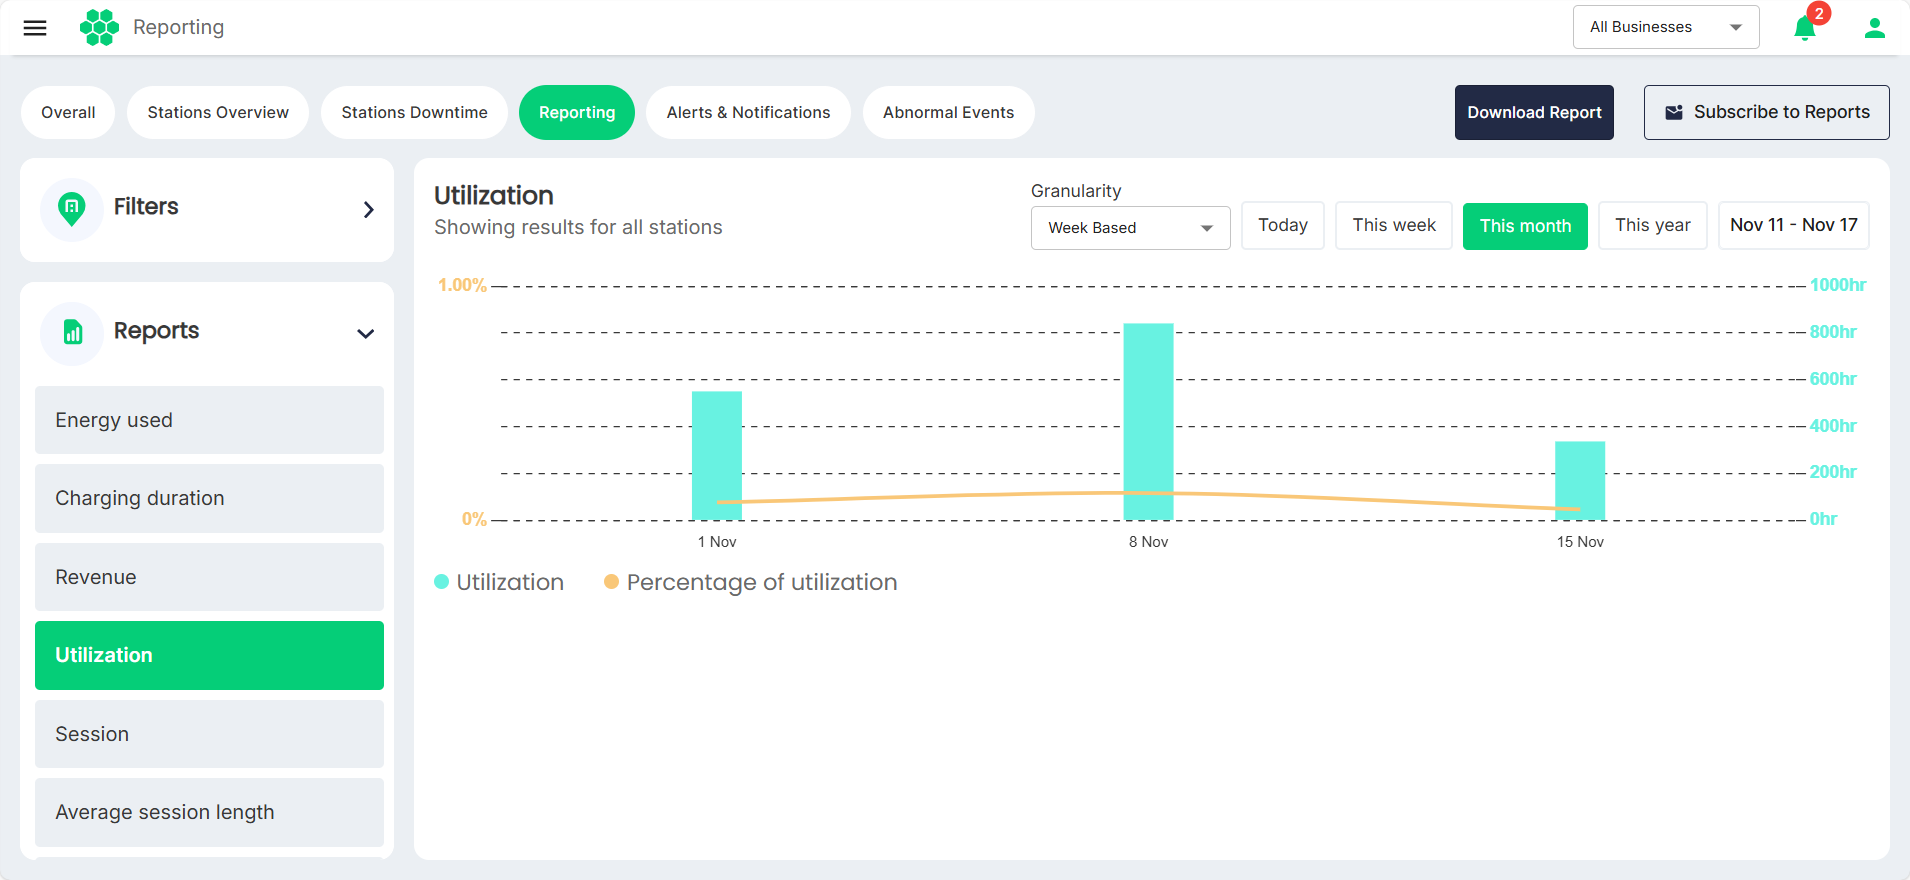
Utilization
Utilization presents a percentage-based view of charger usage relative to capacity. User scan optimize charging station deployment, identify peak and off-peak times, and ensure efficient resource utilization.
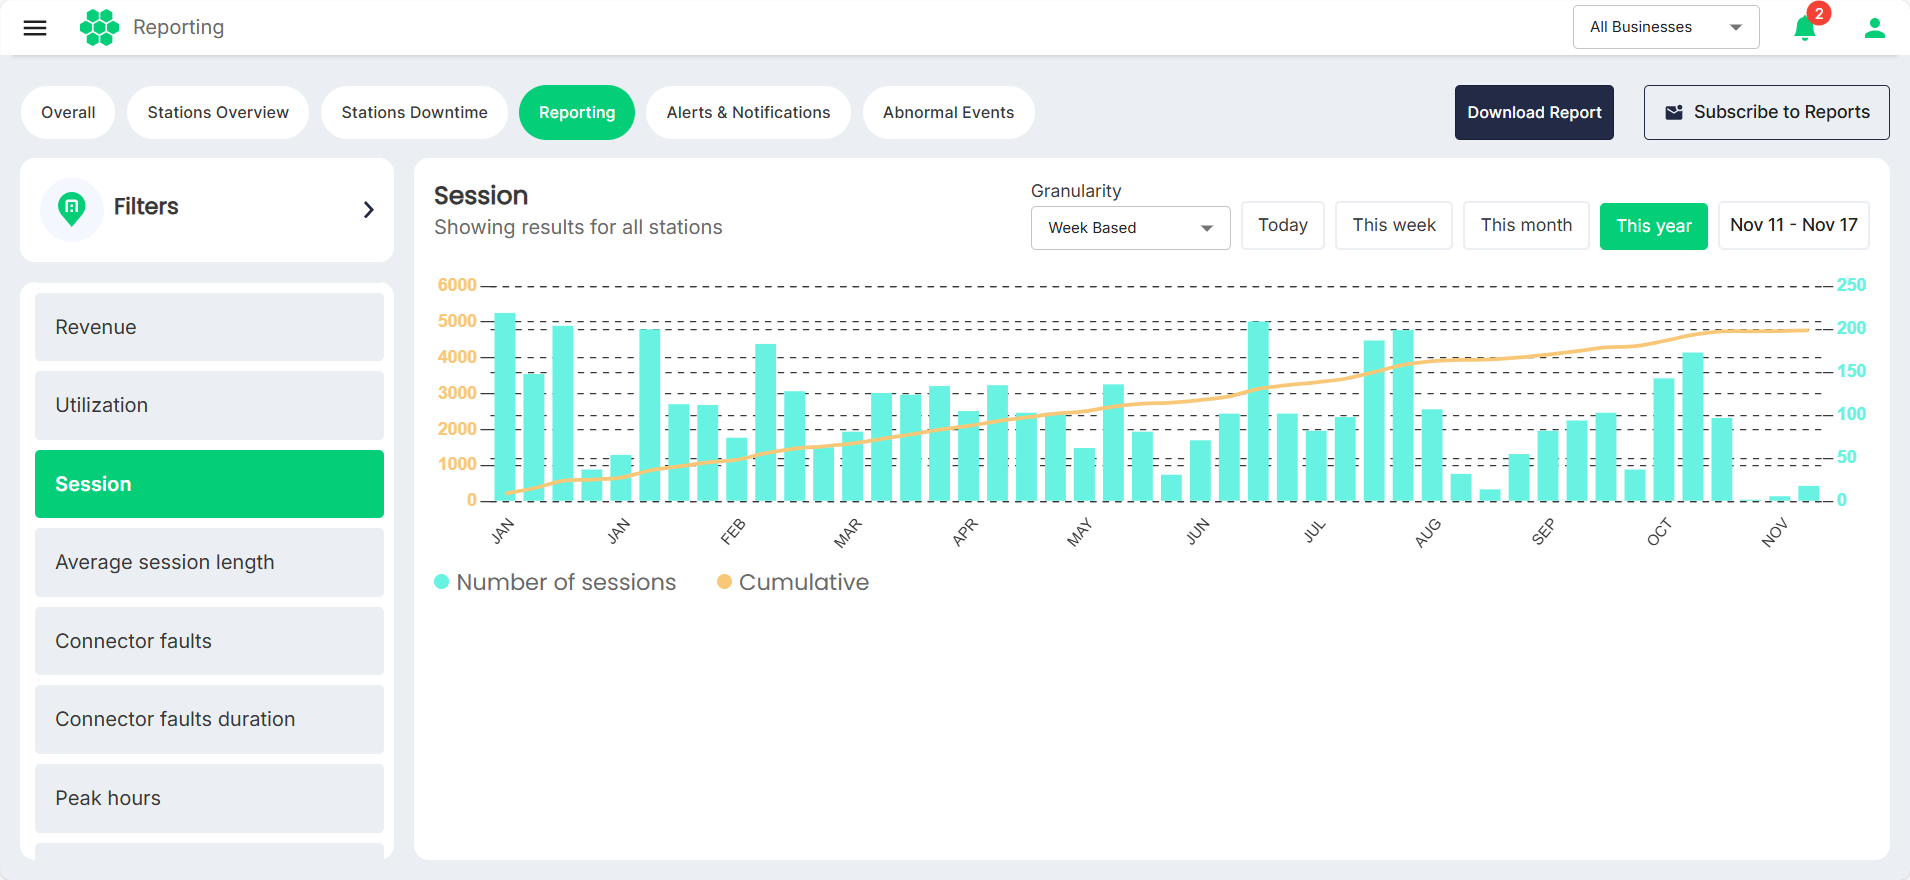
Session
This report provides the number of charging sessions, helping users track over all charging activity.
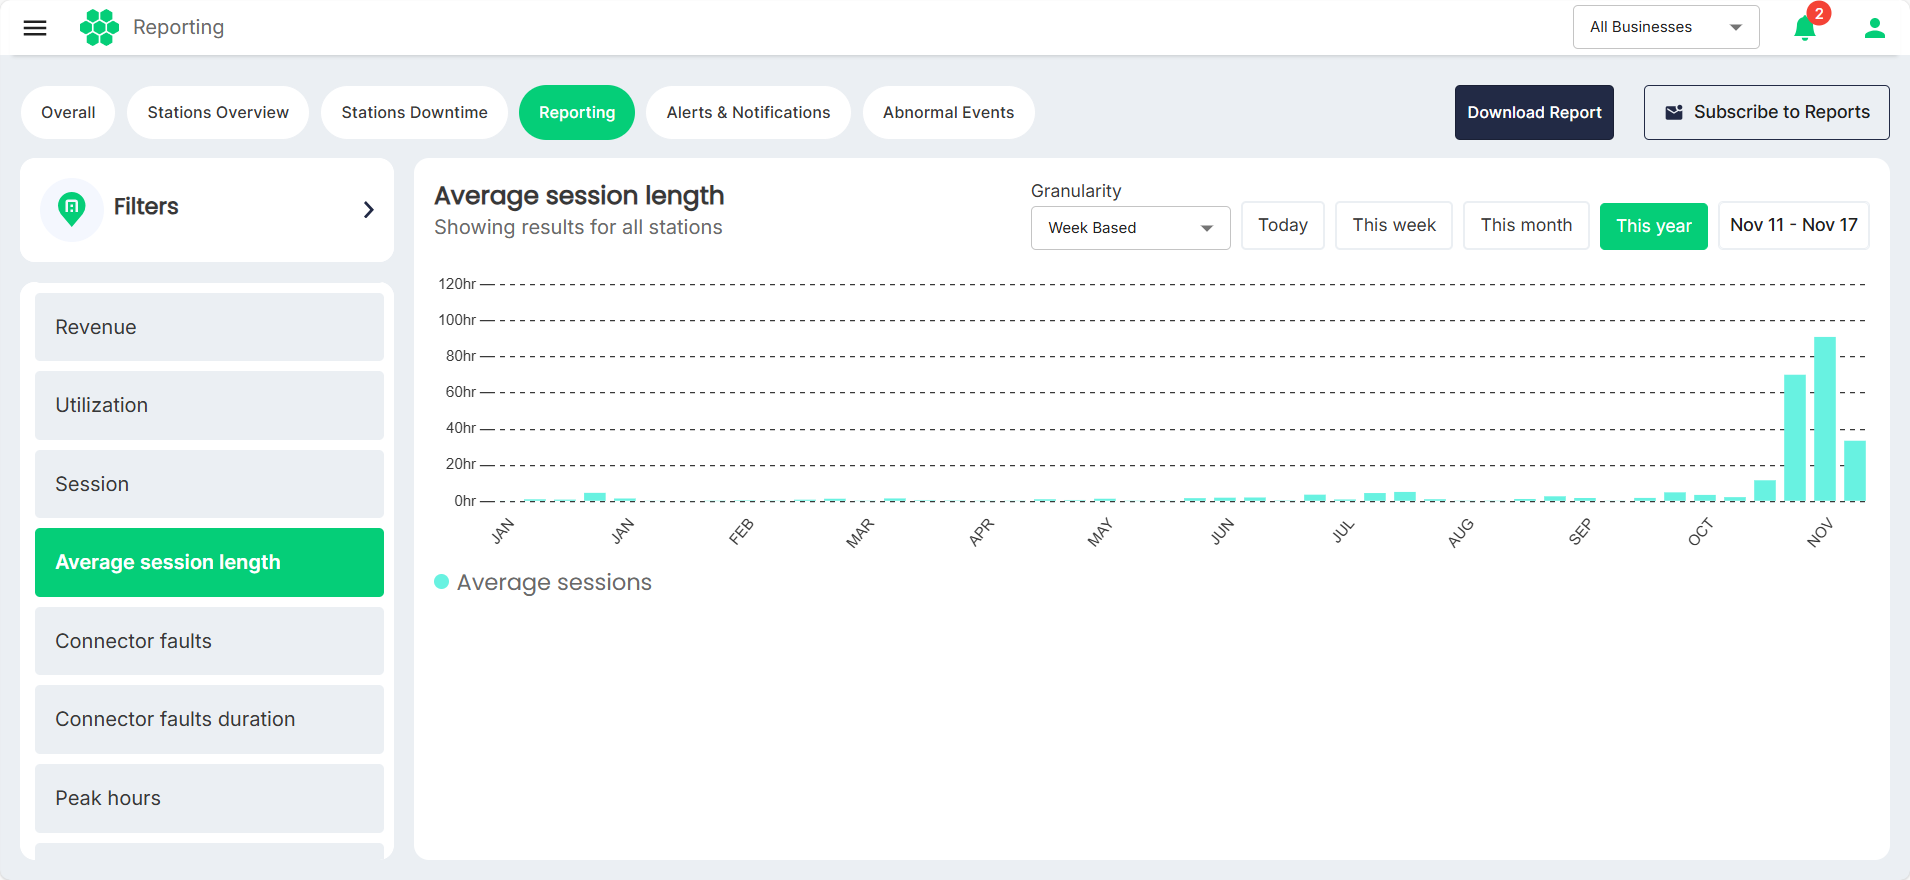
Average session length
Average Session Length indicates the mean duration of charging sessions, offering insights into user behavior.
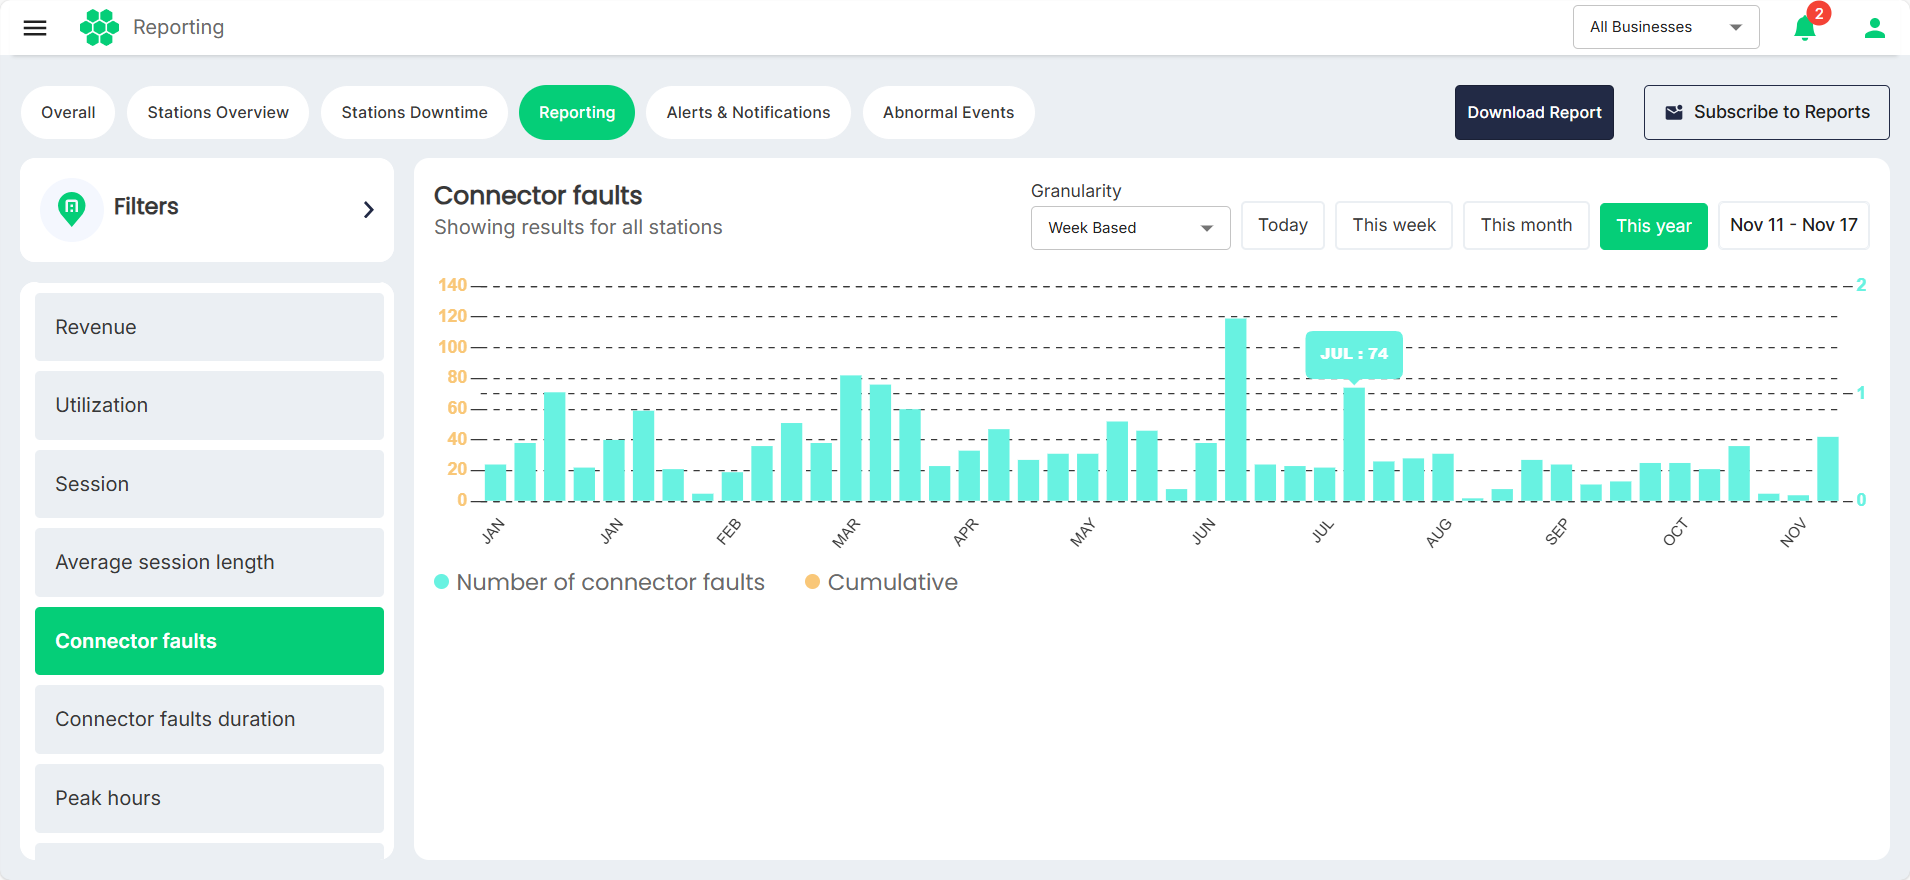
Connector faults
Instances of connector faults are logged, allowing users to identify and address issues promptly for enhanced charging station reliability.
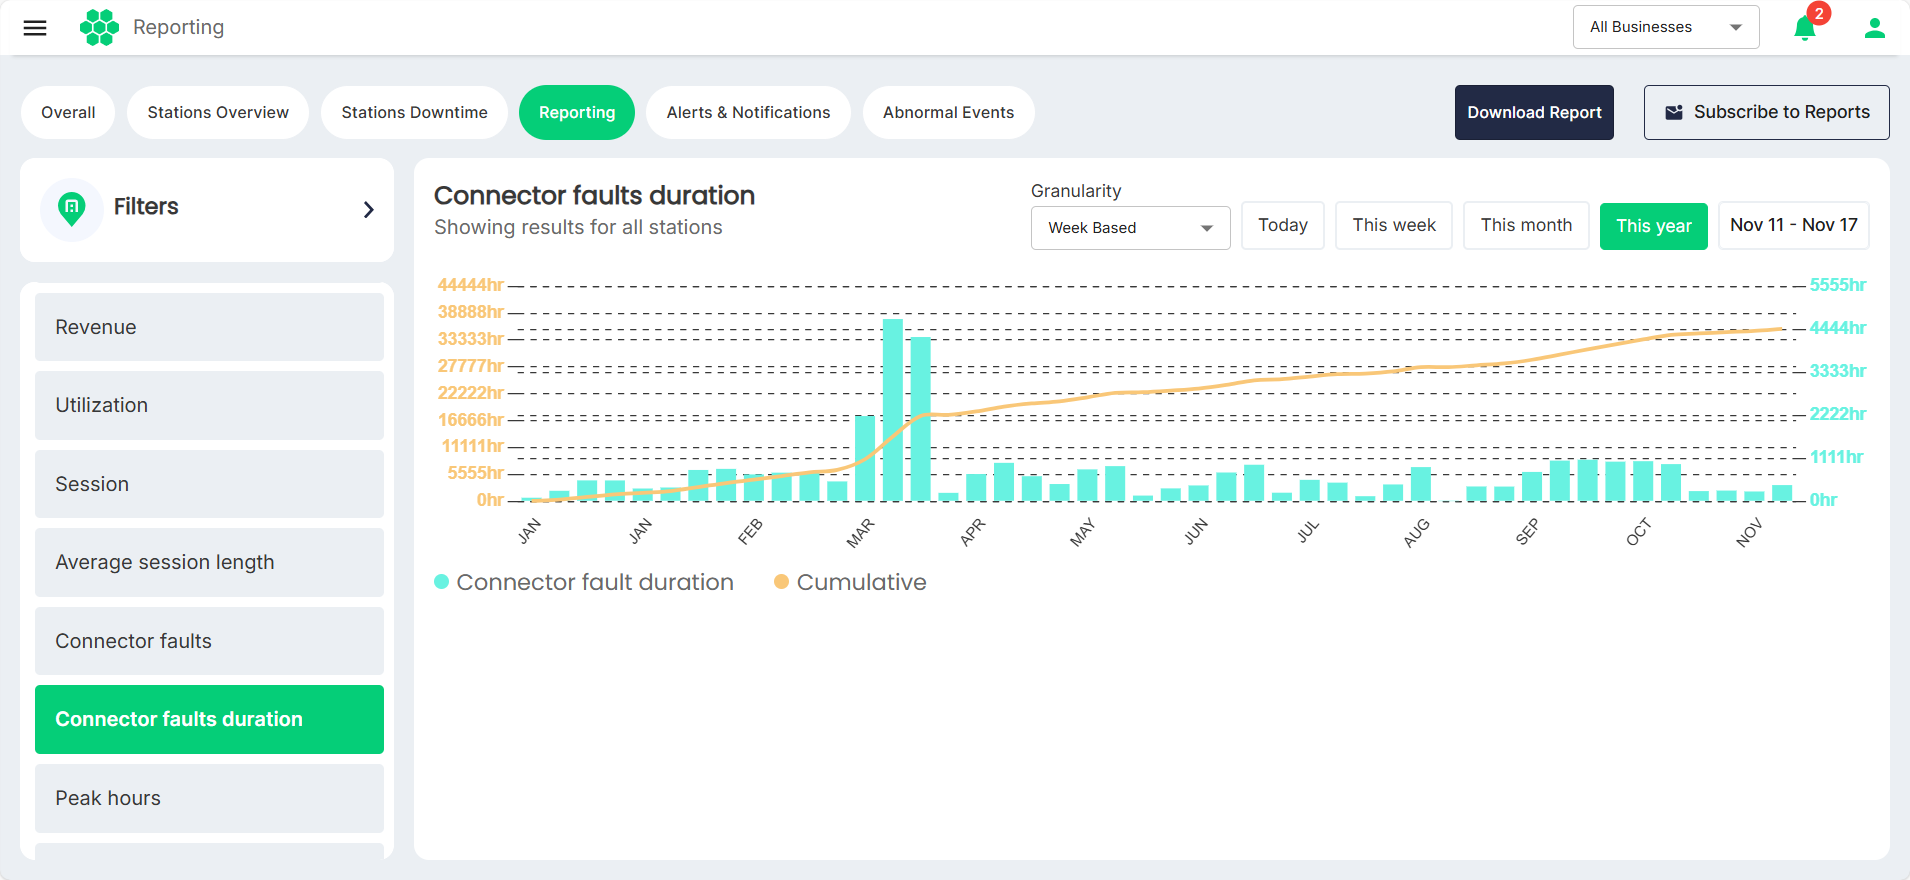
Connector faults duration
This report provides the duration of connector faults.
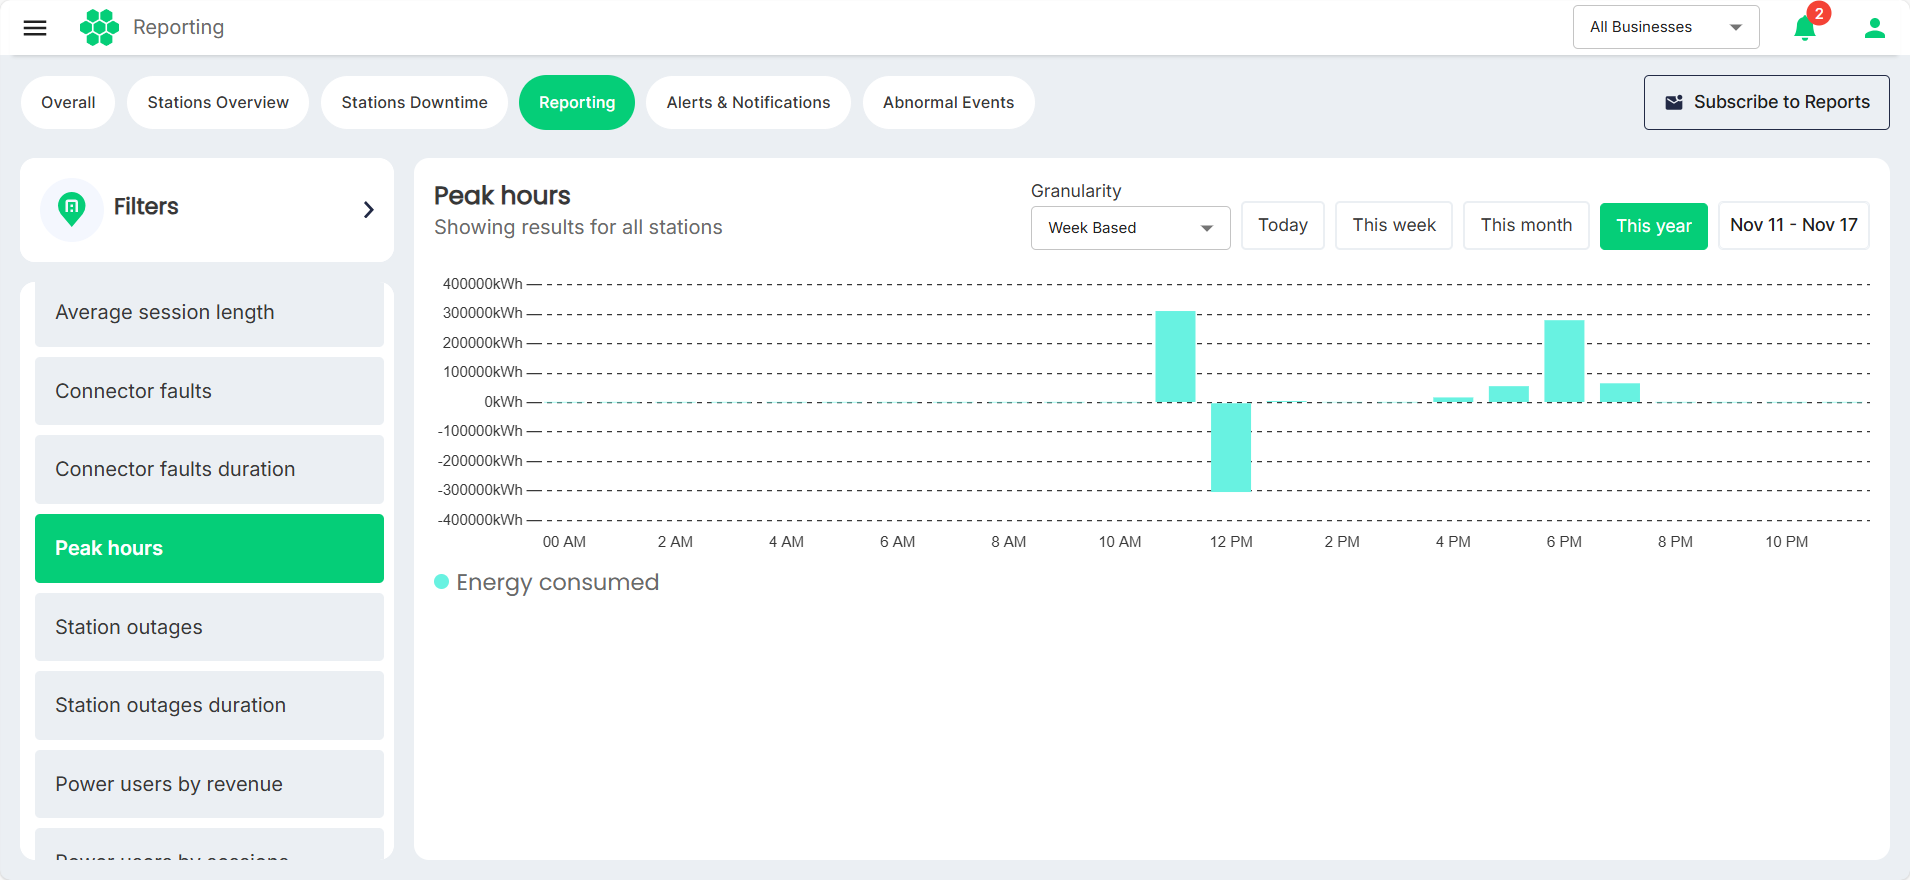
Peak hours
Identification of peak charging hours helps operators optimize resource allocation and plan for increased station usage during peak periods.
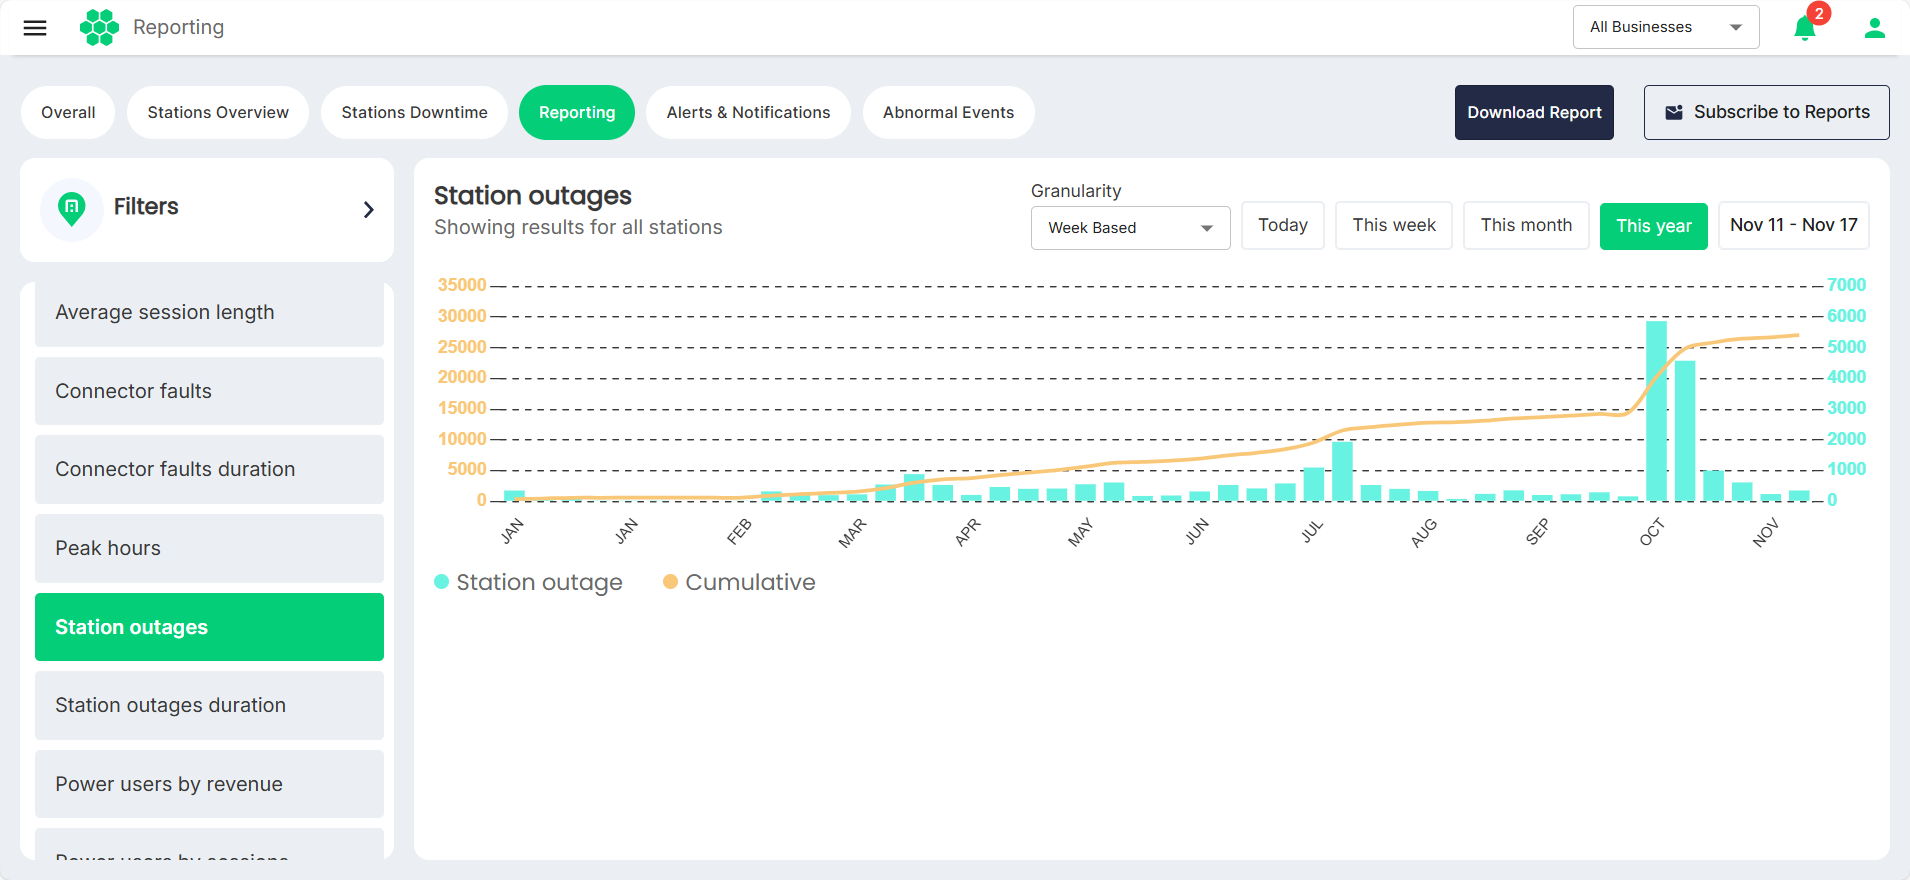
Station outages
This report logs instances of station unavailability, allowing users to monitor downtime patterns and implement preventive measures.
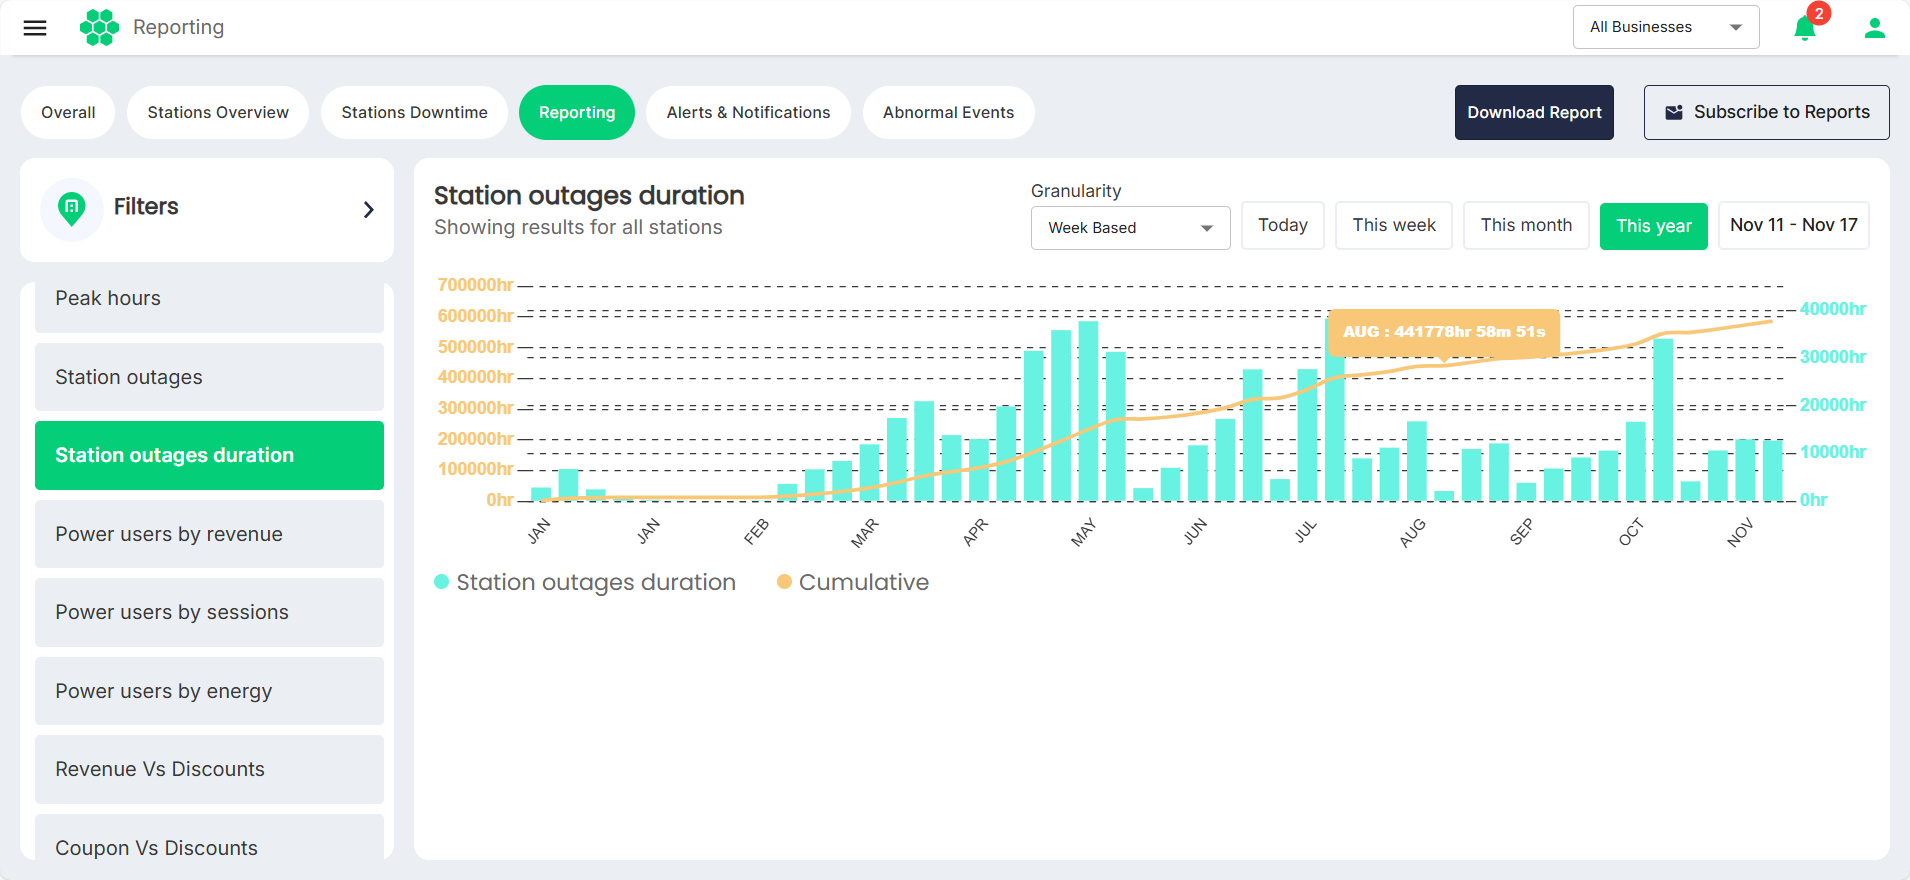
Station outages duration
Duration of station outages is detailed, offering insights into the impact of down time on charging station availability.
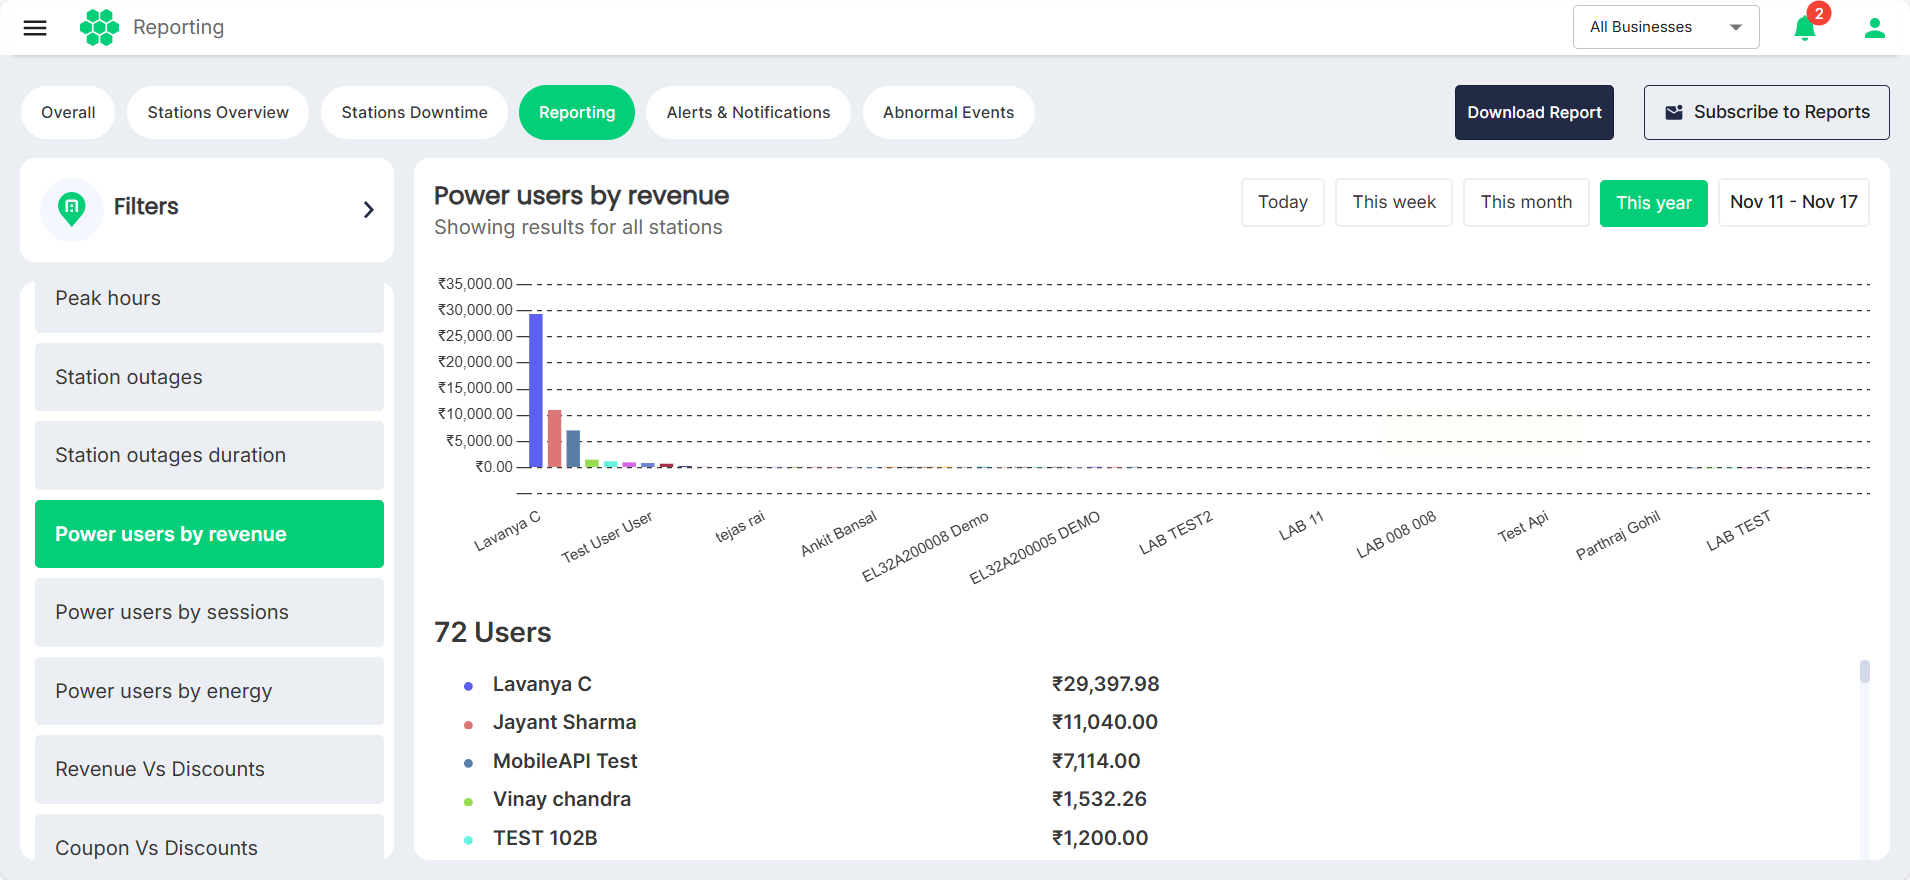
Power users by revenue
This report identifies users contributing significantly to revenue, enabling targeted marketing efforts and personalized services.
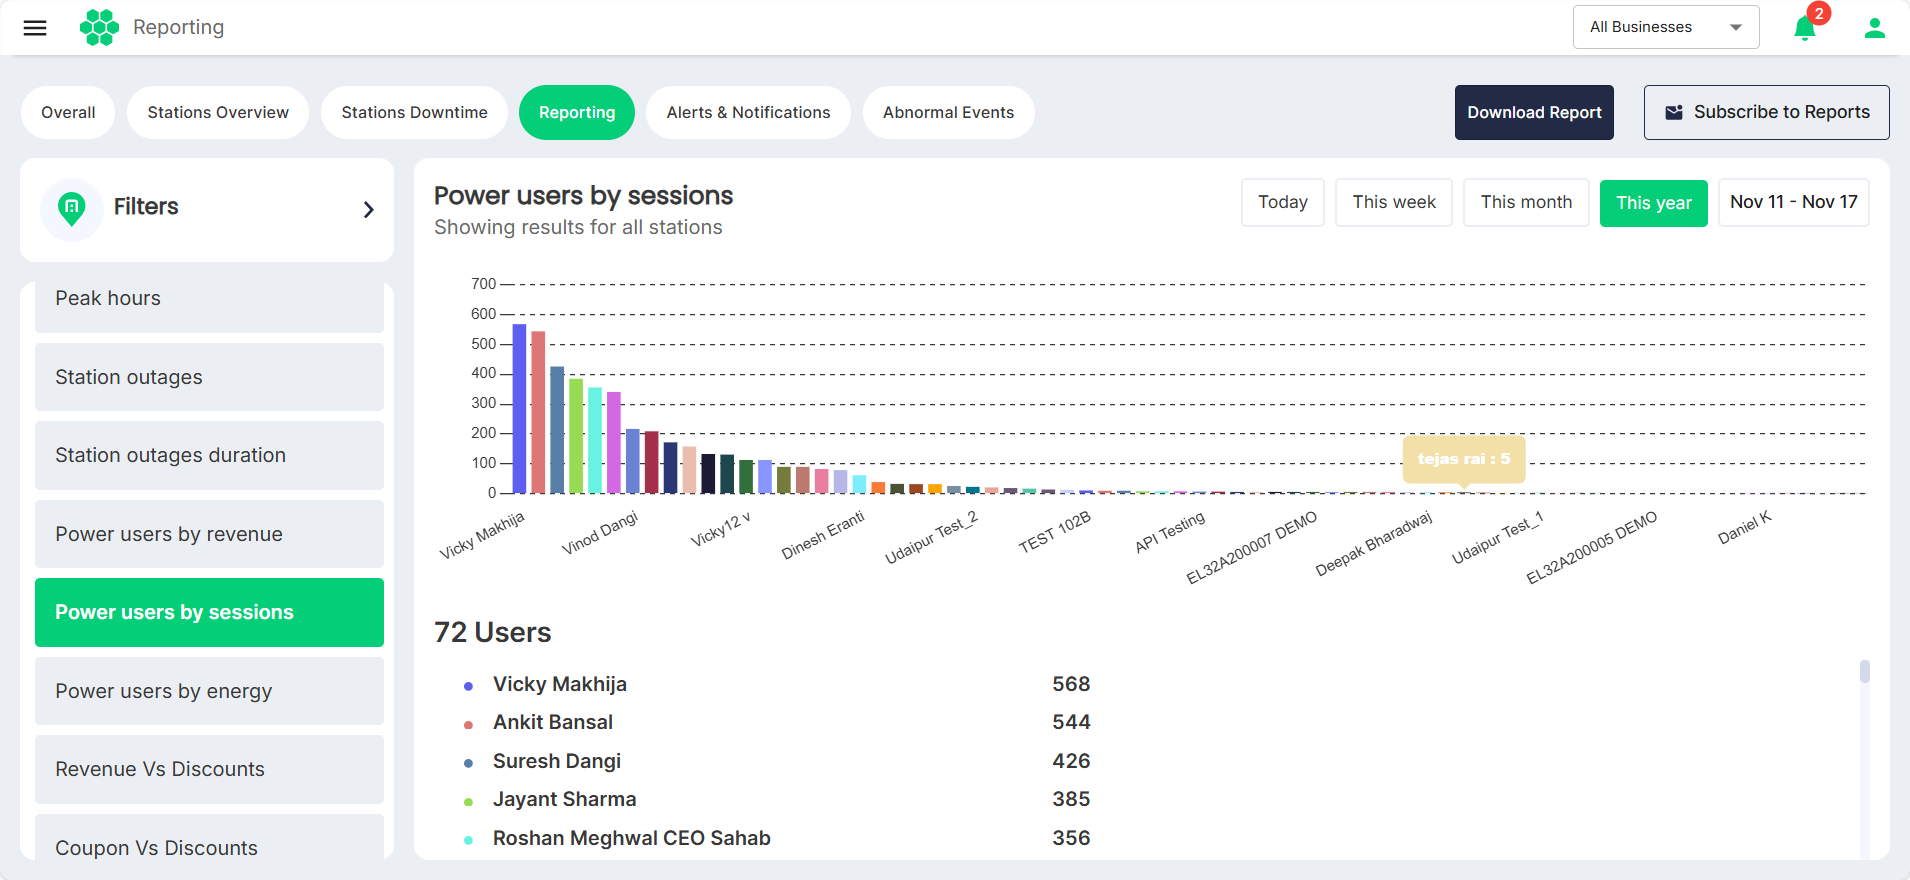
Power users by sessions
Identification of users with a high number of charging sessions helps operators understand and cater to specific user needs.
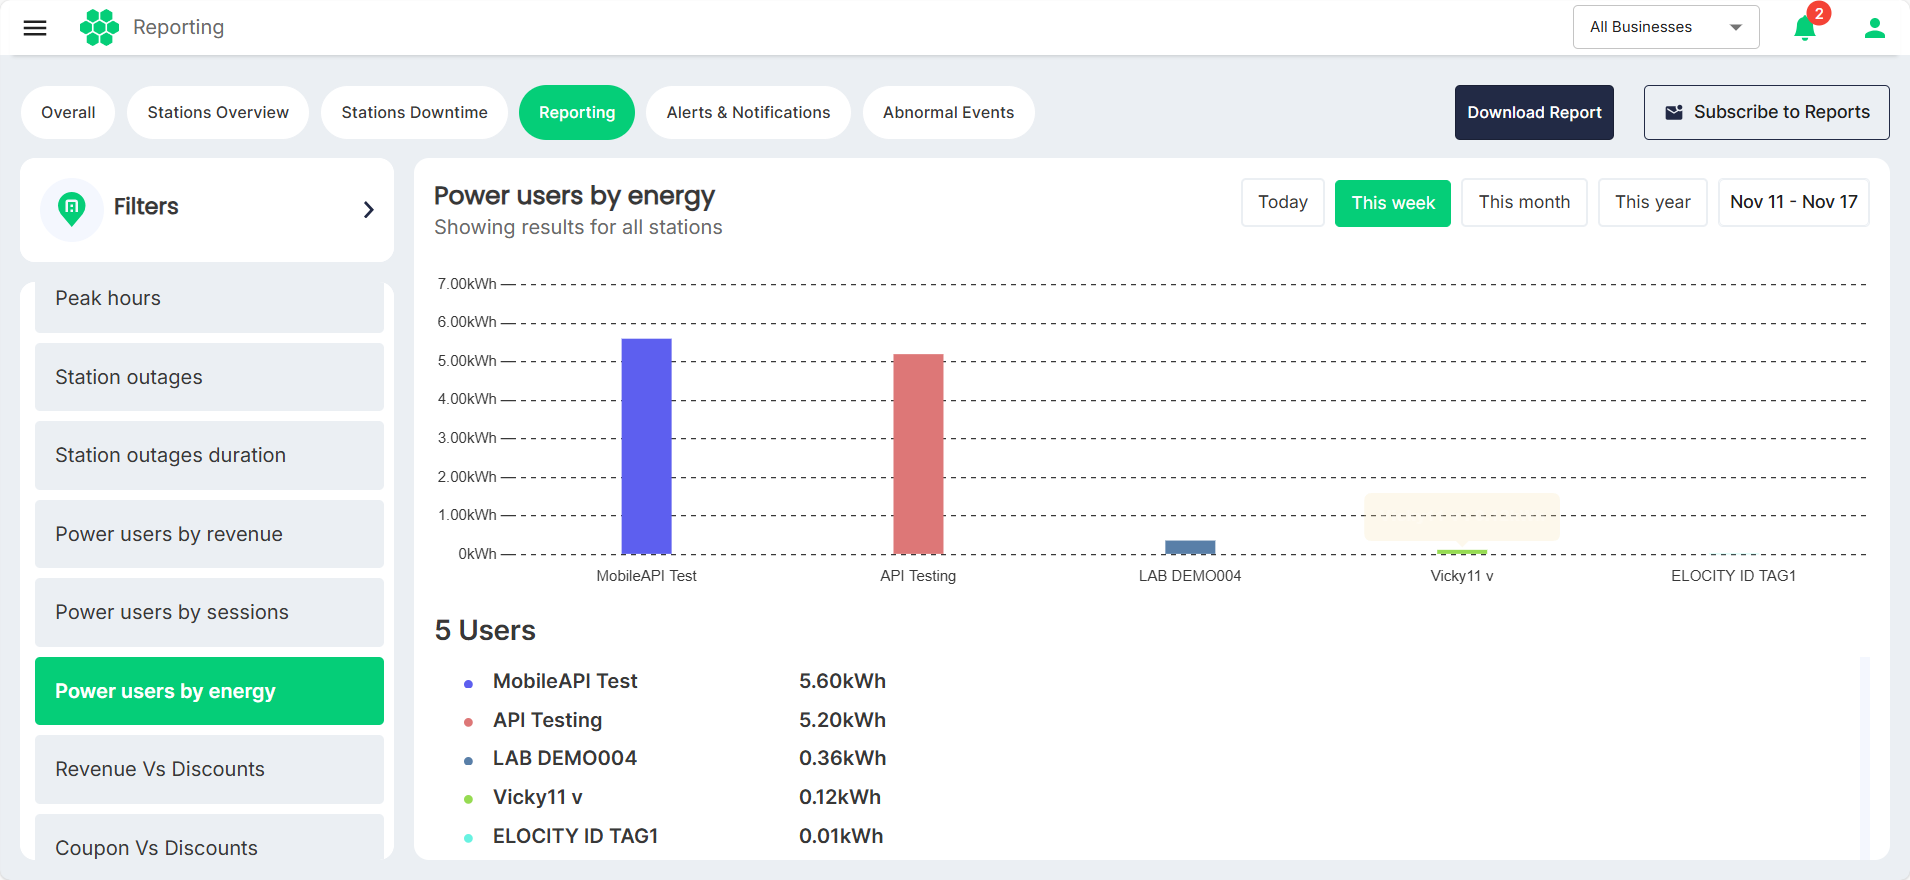
Power users by energy
This report showcases users with high energy consumption.
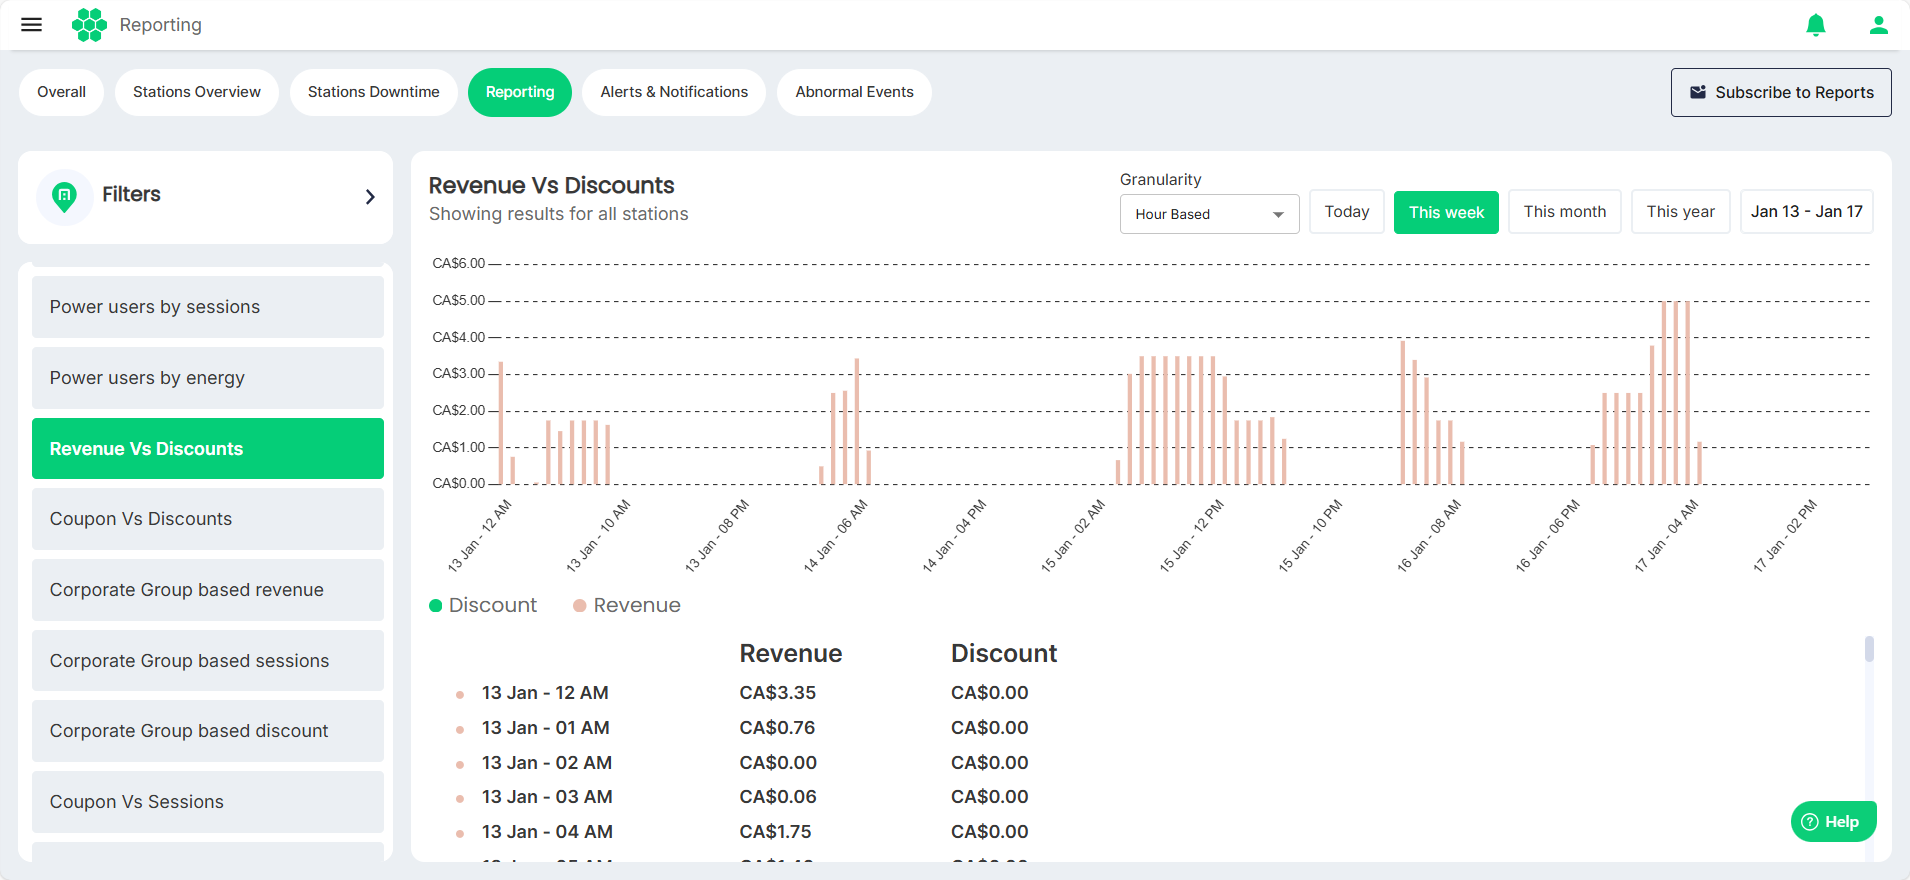
Revenue Vs Discounts
Comparison of revenue and discounts aids in assessing the impact of discounting strategies on overall financial performance.
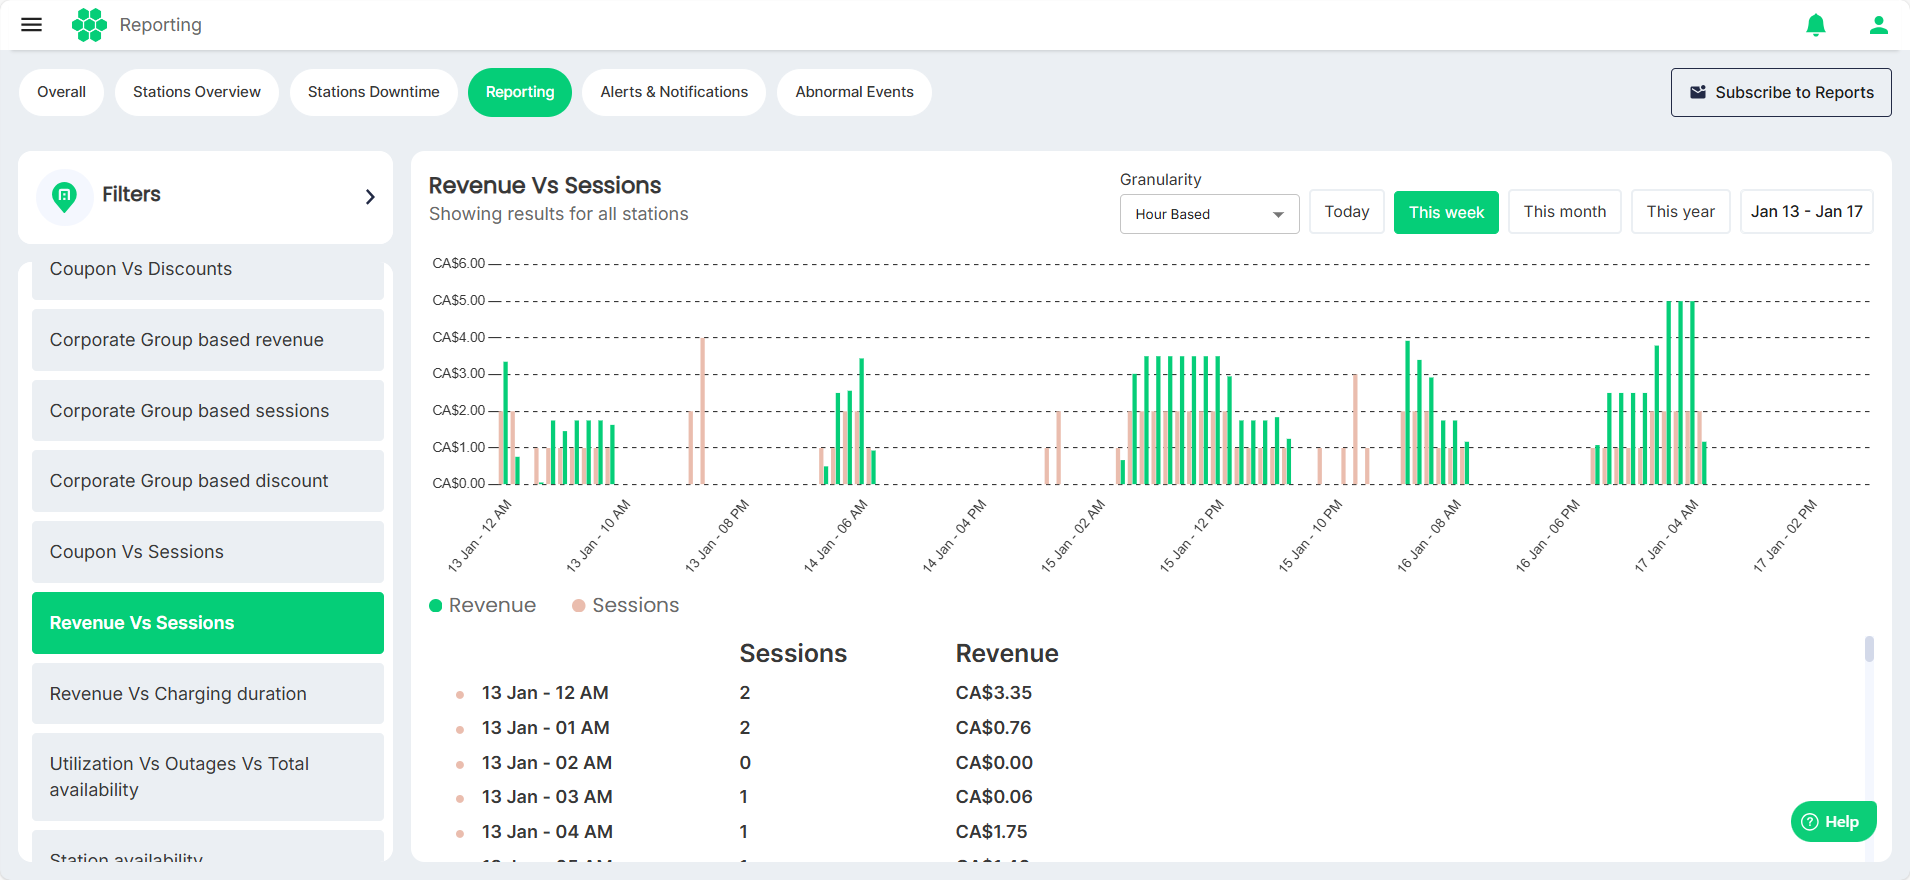
Revenue Vs Sessions
Correlation between revenue and charging sessions helps operators understand the financial impact of user activity.
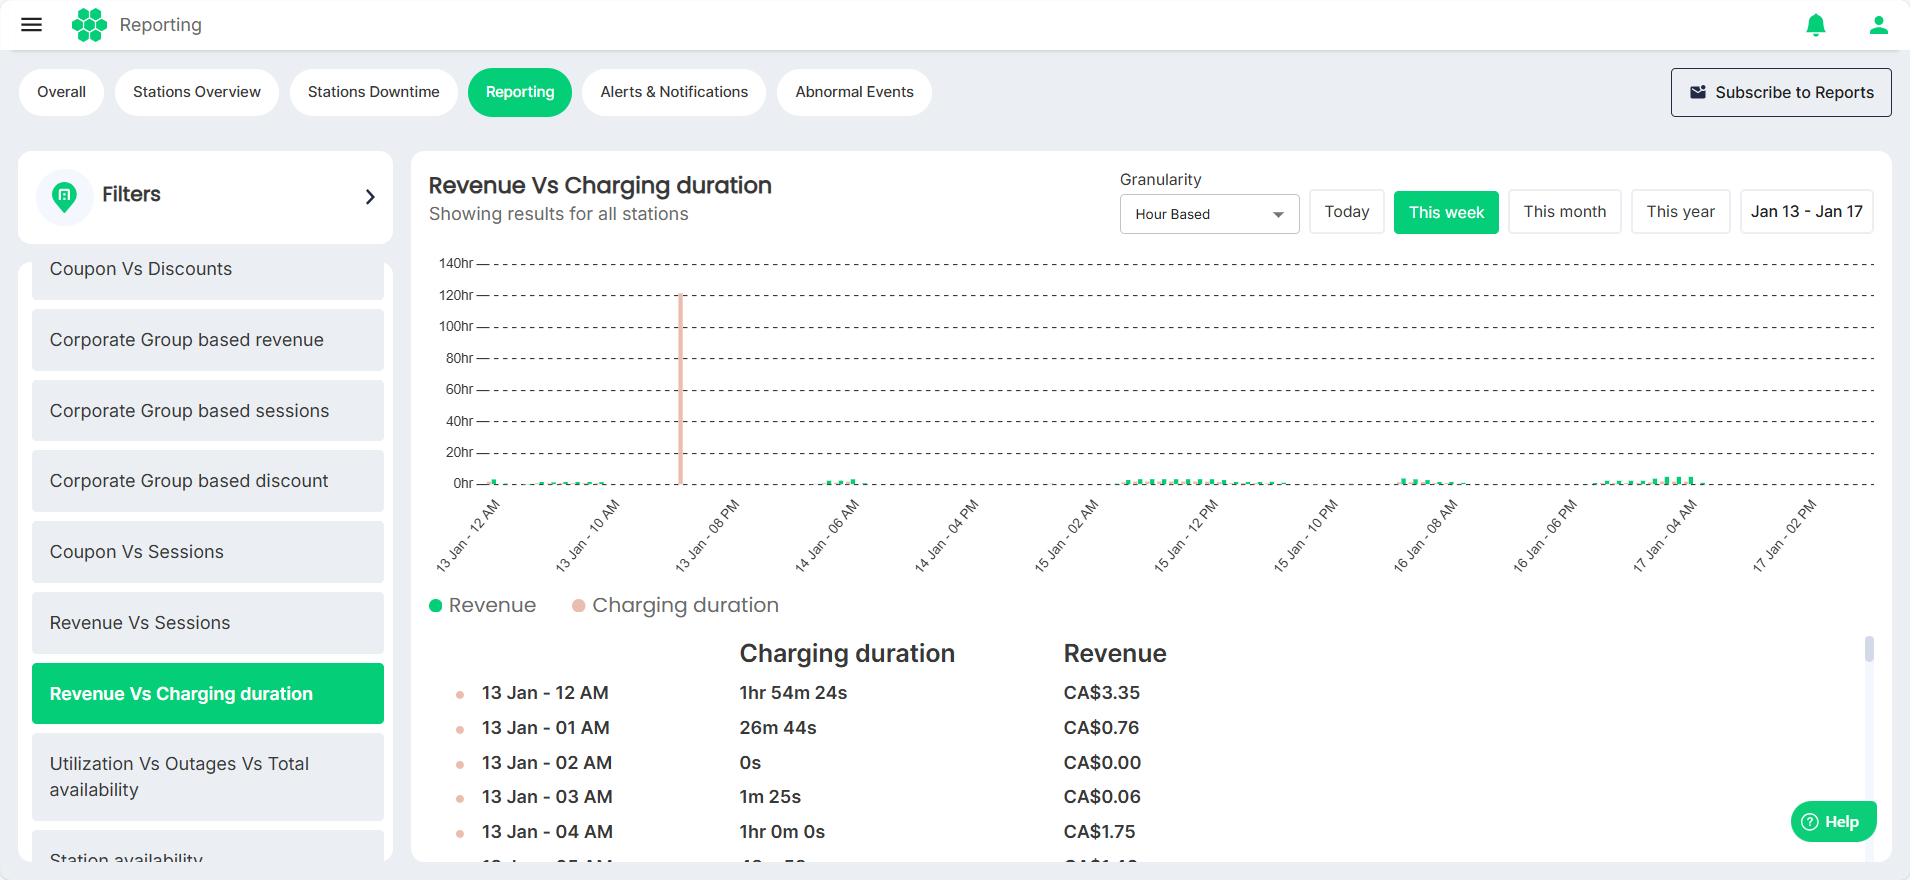
Revenue Vs Charging duration
This report correlates revenue with charging duration.
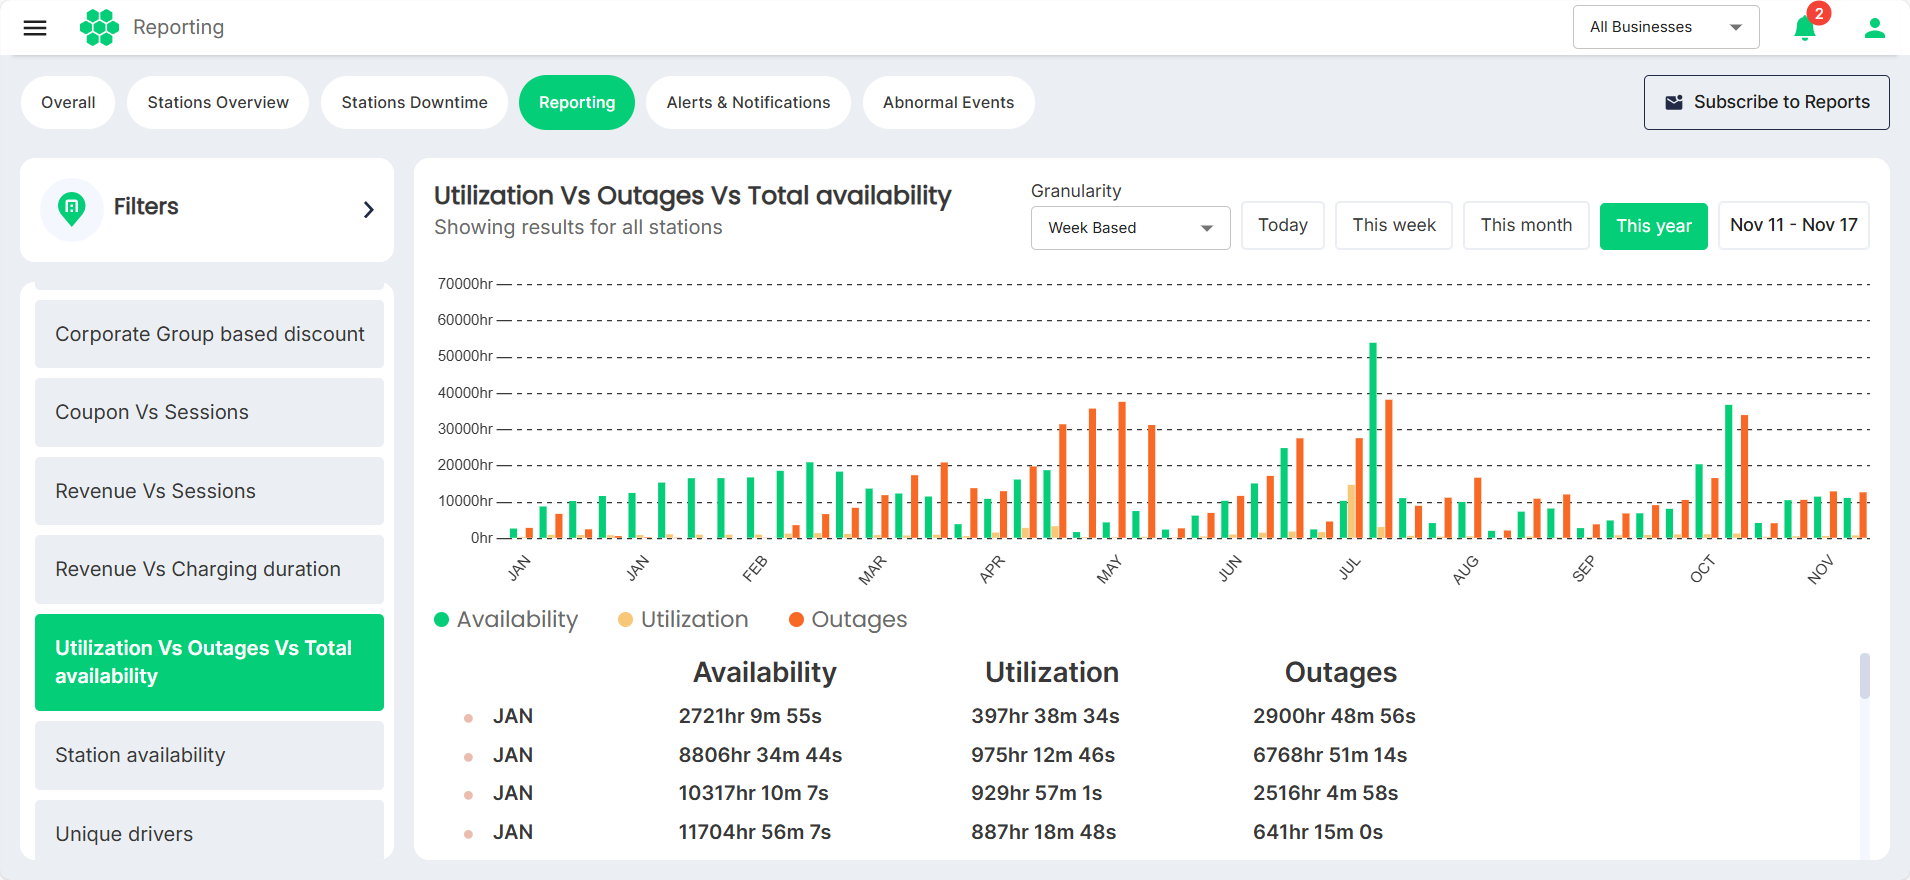
Utilization Vs Outages Vs Total availability
Comparative analysis of utilization, outages, and total availability offers a holistic view of charging station performance.
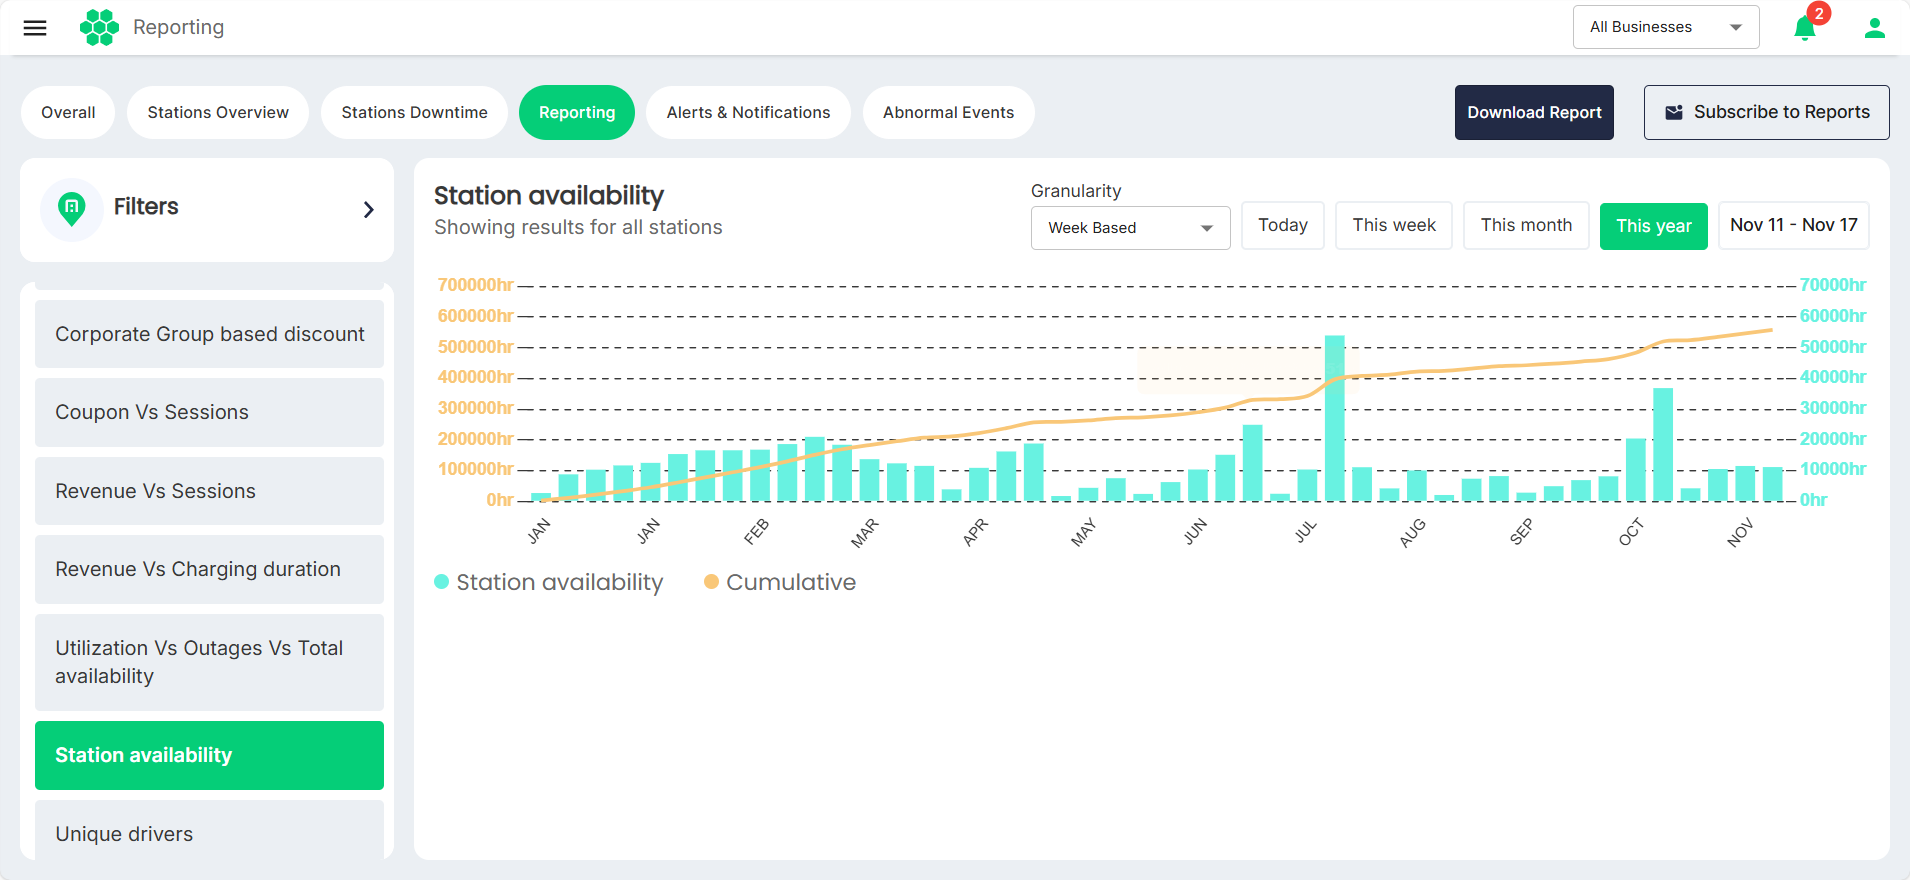
Station availability
This report provides an overview of station availability, allowing users to assess overall infrastructure reliability.
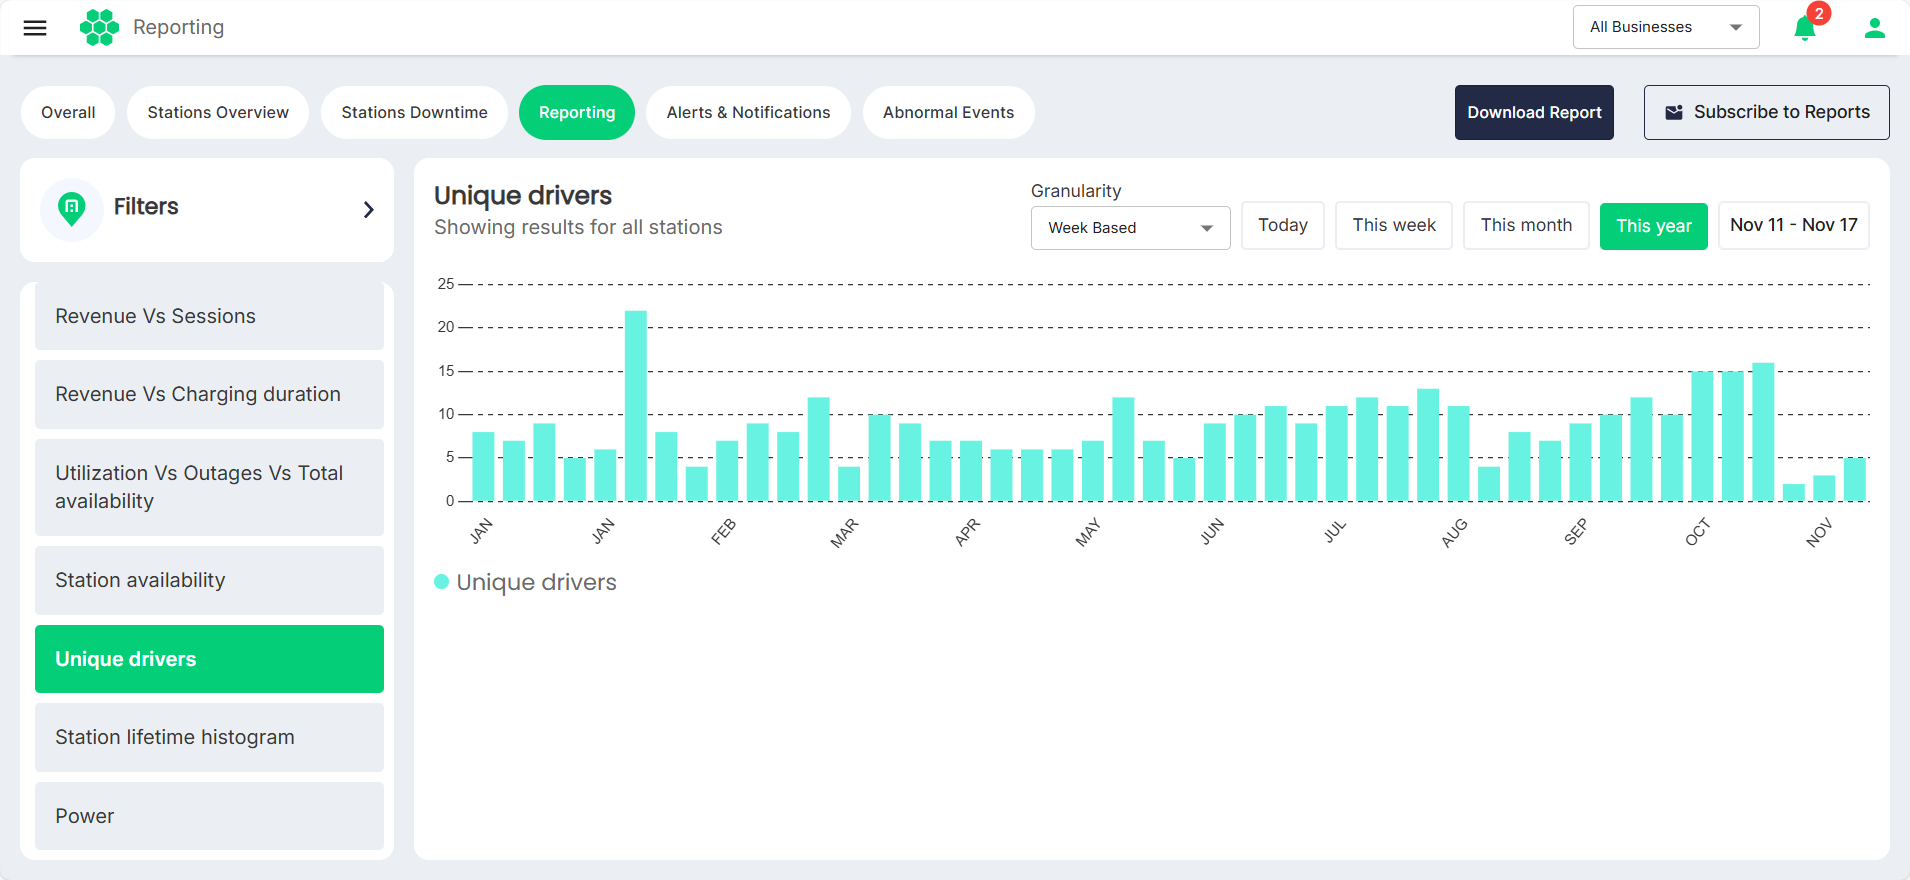
Unique drivers
The count of distinct drivers utilizing the chargers can be identified.
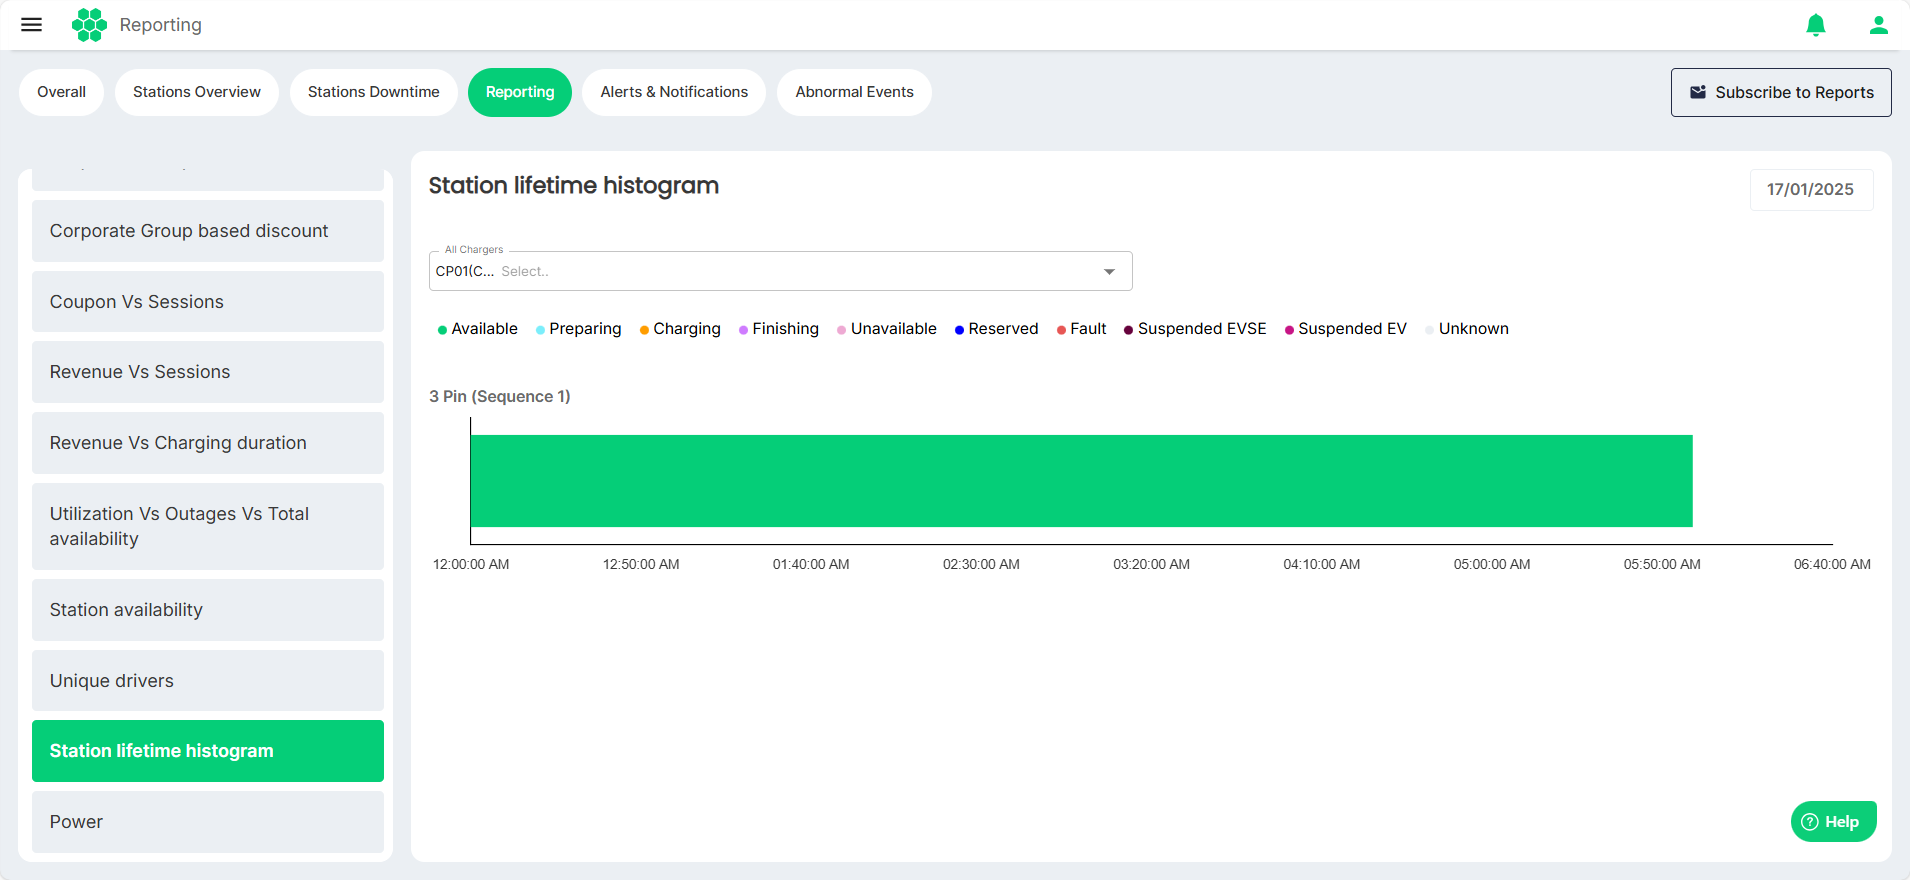
Station lifetime histogram
The distribution of station lifetimes is visualized.
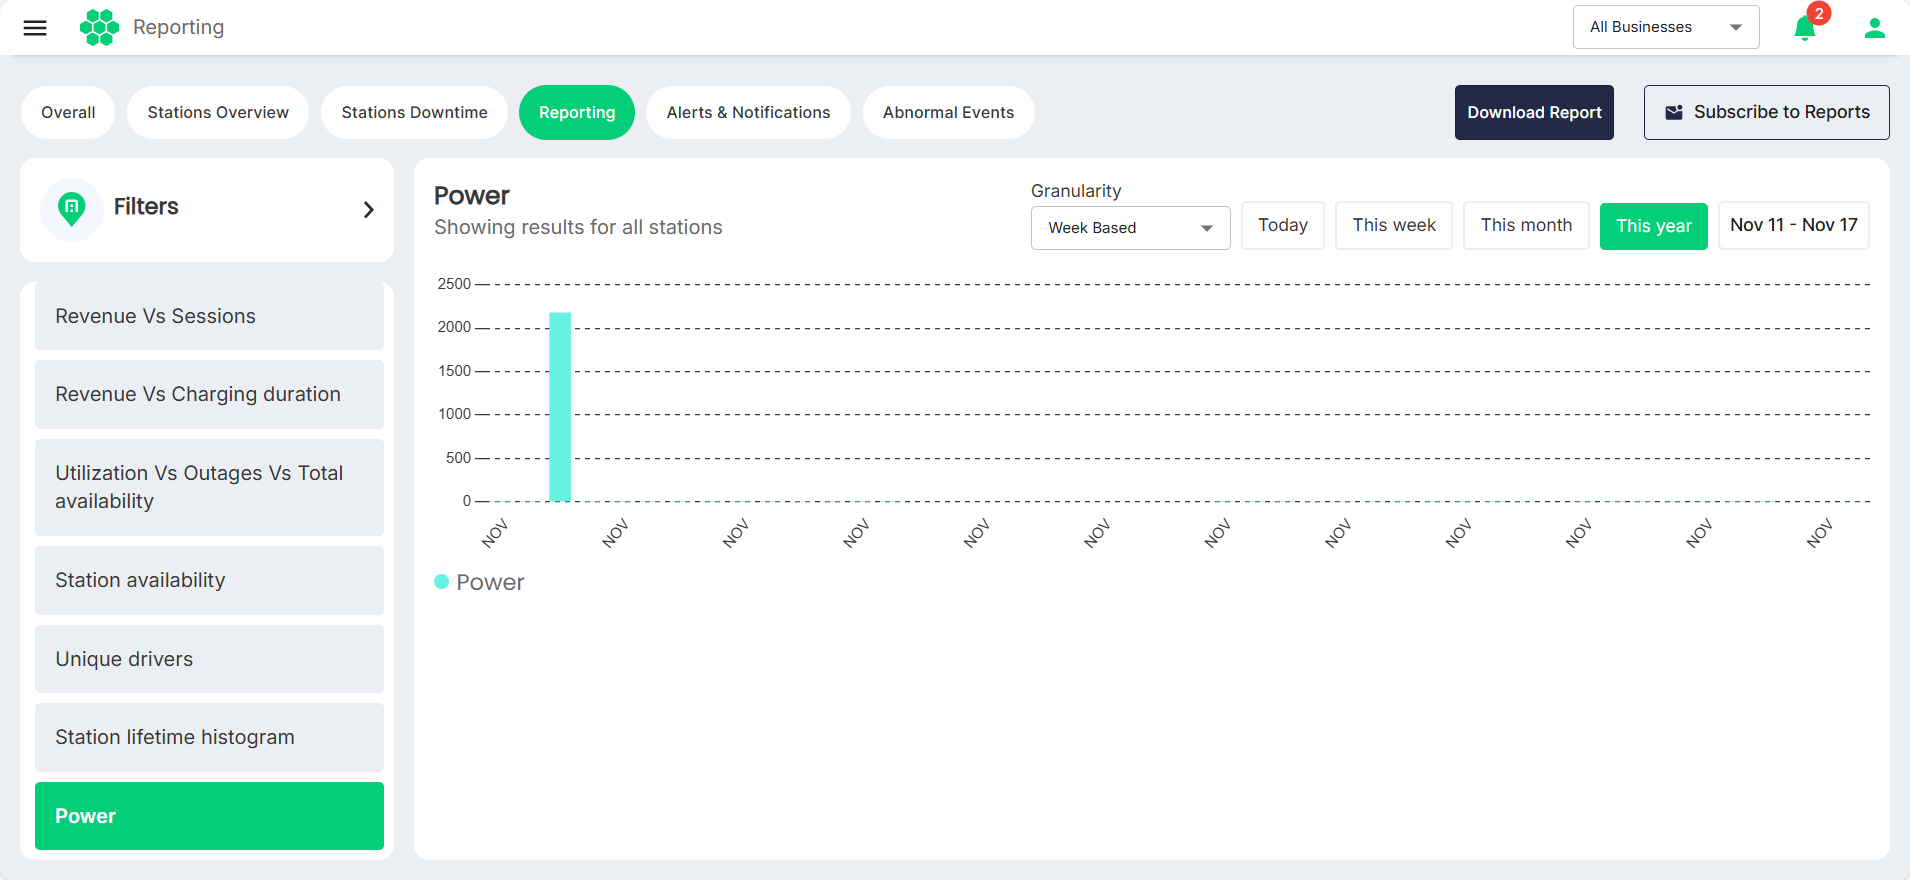
Power
Downloading Report
You can also download reports to gain valuable insights tailored to your needs. Select the report you want to download, and customize it with the date filters. Then, click the Download Report button to save it in CSV format. The CSV file lets you view data at more detailed and granular levels. This process gives you actionable data, helping you make informed decisions and effectively monitor performance or usage trends.
Subscribing to Reports
Subscribing to reports ensures you receive regular updates with the data you need, delivered directly to your registered email ID.
-
Navigate to the Reports section and select the report you want to subscribe to.
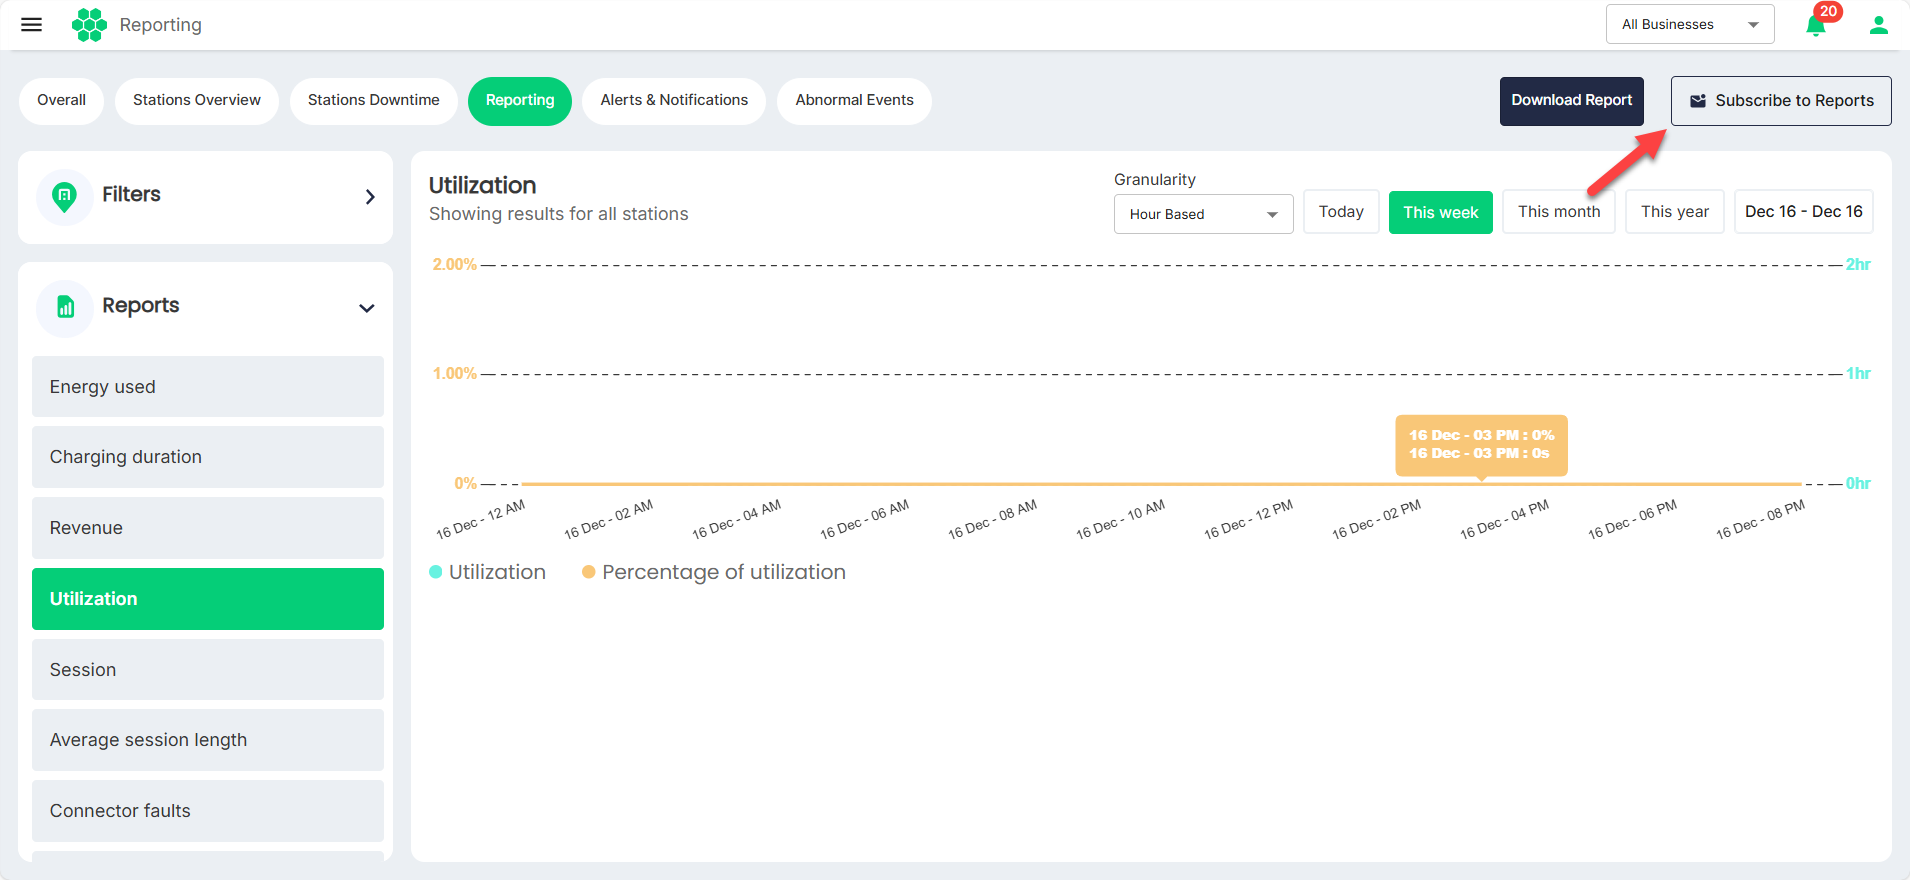
-
Click the Subscribe to Reports button.
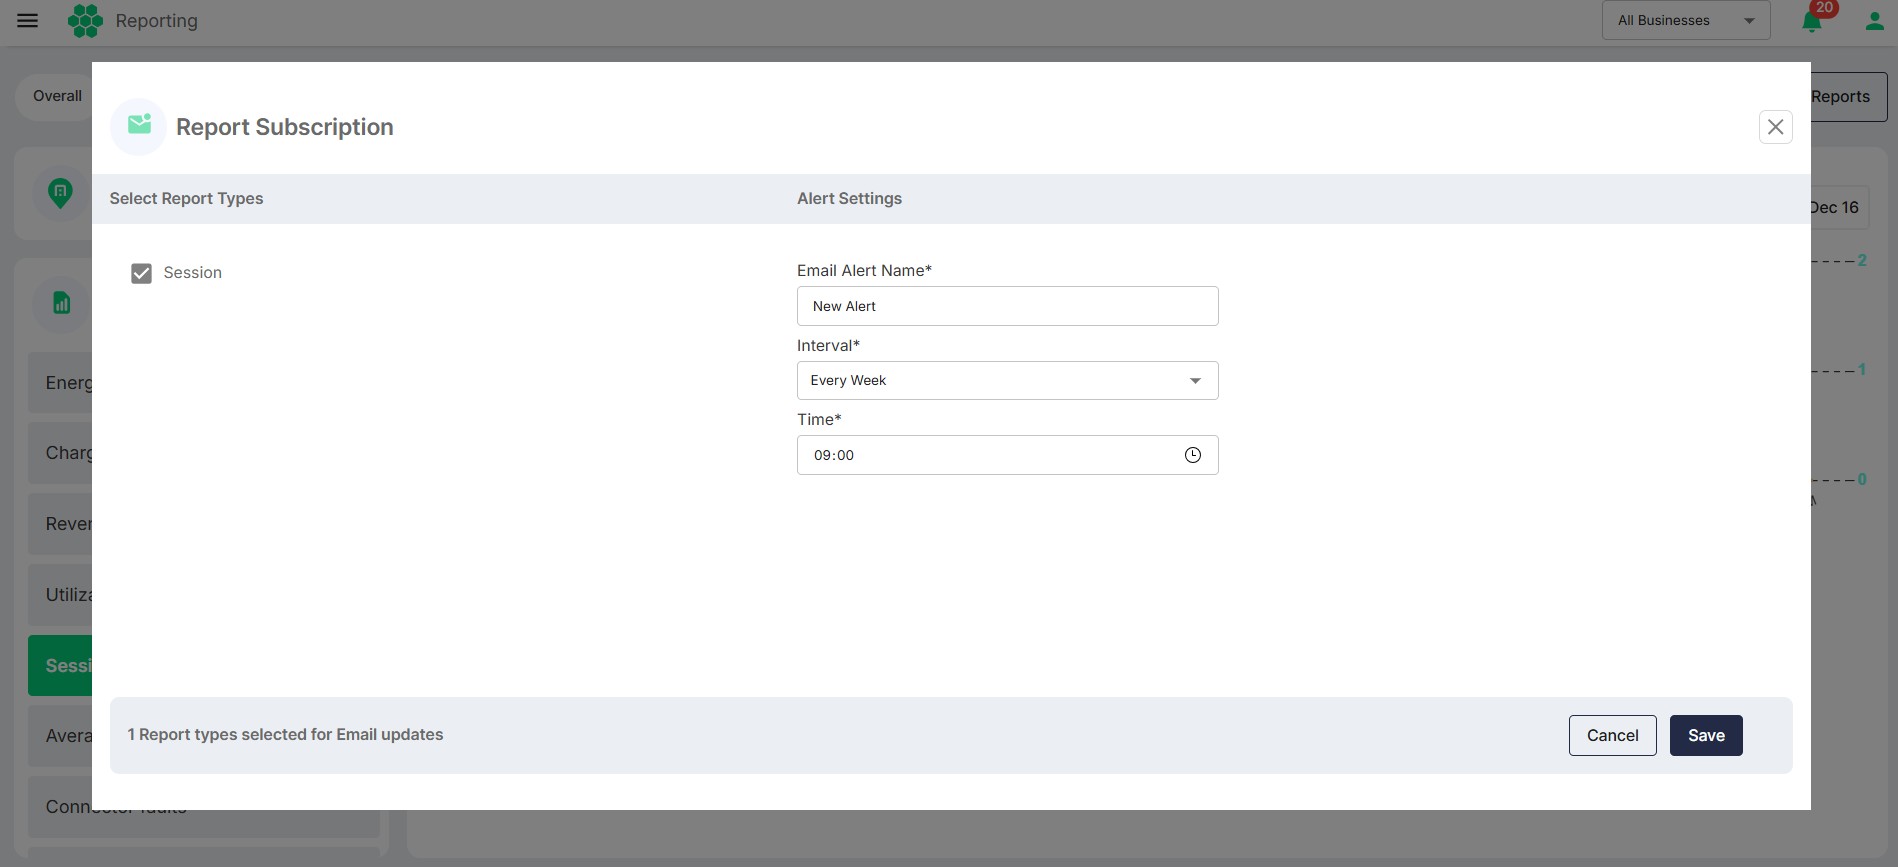
-
Provide the following details on the Report Subscription screen:
- Email Alert Name: A name to identity the alert.
- Interval: The frequency at which the report will be sent (daily, every two days, every week. or every month).
- Time: The time of the day when the report will be sent.
-
Click Save.