Stations Downtime
Purpose
The Stations Downtime dashboard provides a historical record of charge point disconnections from the HIEV network. Each record identifies the affected location and station, when the disconnection began, when connectivity was restored, and the recorded duration of the event.
Use this page to investigate recurring connectivity problems, compare downtime across locations, identify prolonged disconnections, and export records for operational review.
Downtime records describe network disconnections. They should be reviewed together with the station's current status and technical logs when determining the underlying cause.
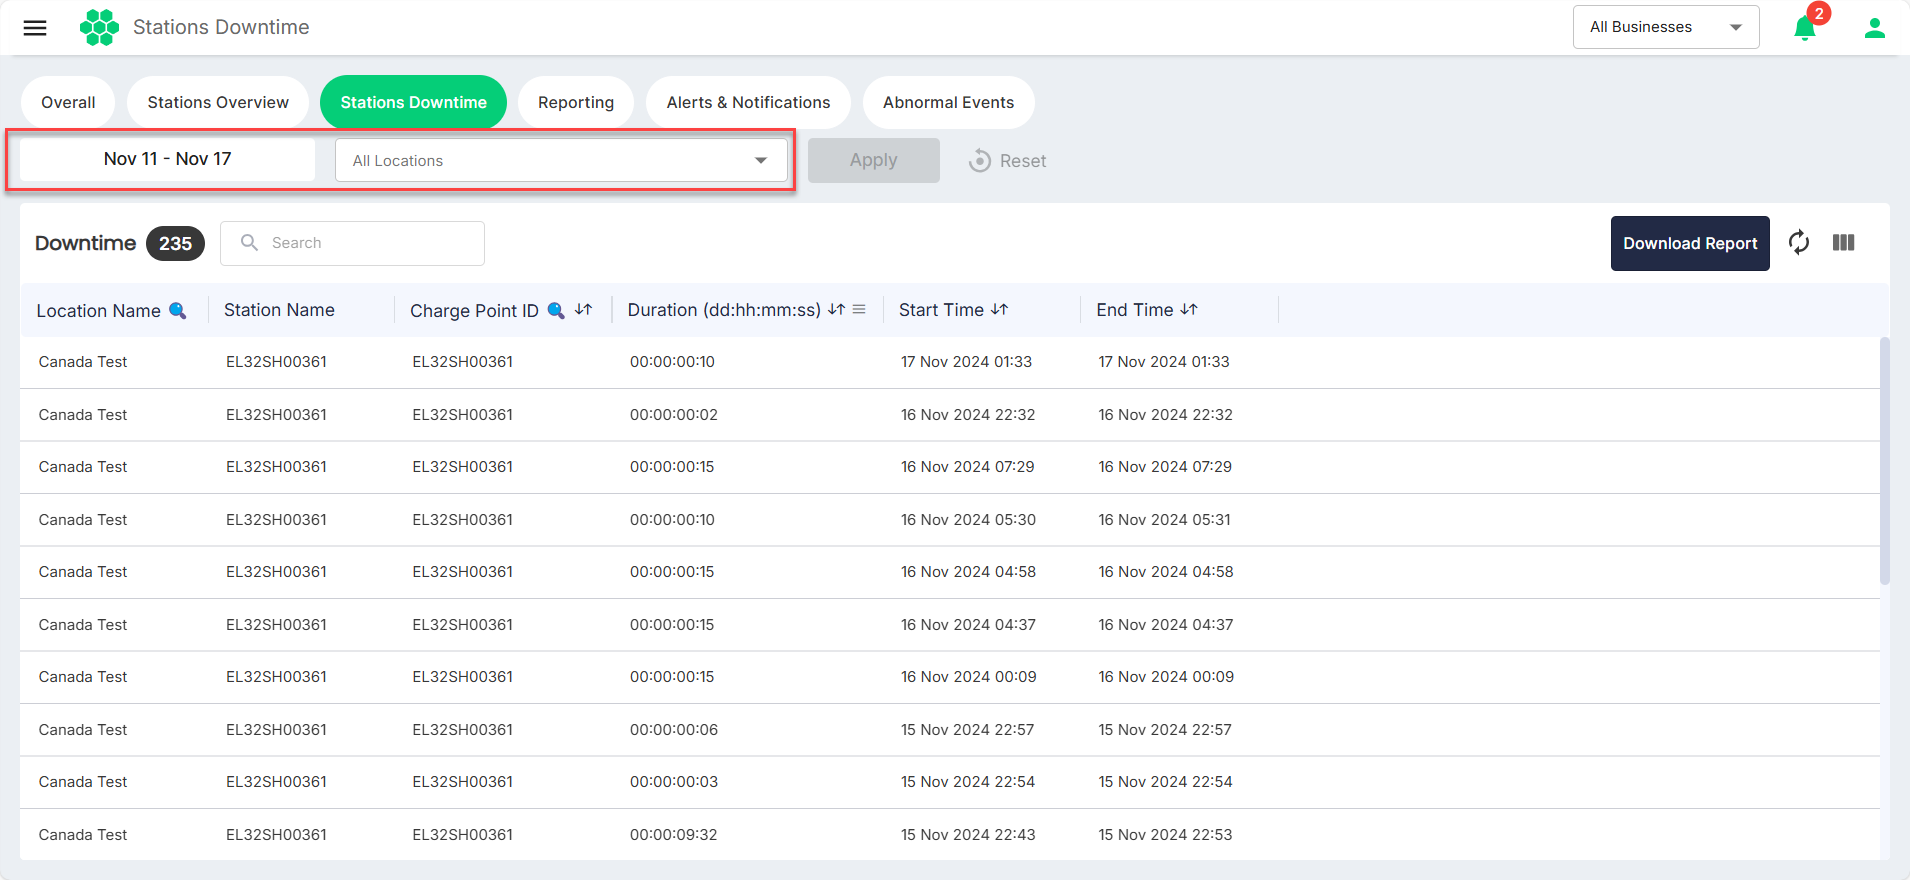
Accessing the page
- Sign in to the HIEV portal.
- Open Dashboard.
- Select Stations Downtime.
The information and locations available on the page depend on the user's business assignments and permissions.
Selecting the business scope
Use the business selector in the page header to choose All Businesses or a specific permitted business. This selection defines the organizational scope of the downtime results.
When reviewing a reported issue, confirm the selected business before applying the date and location filters.
Date-range filter
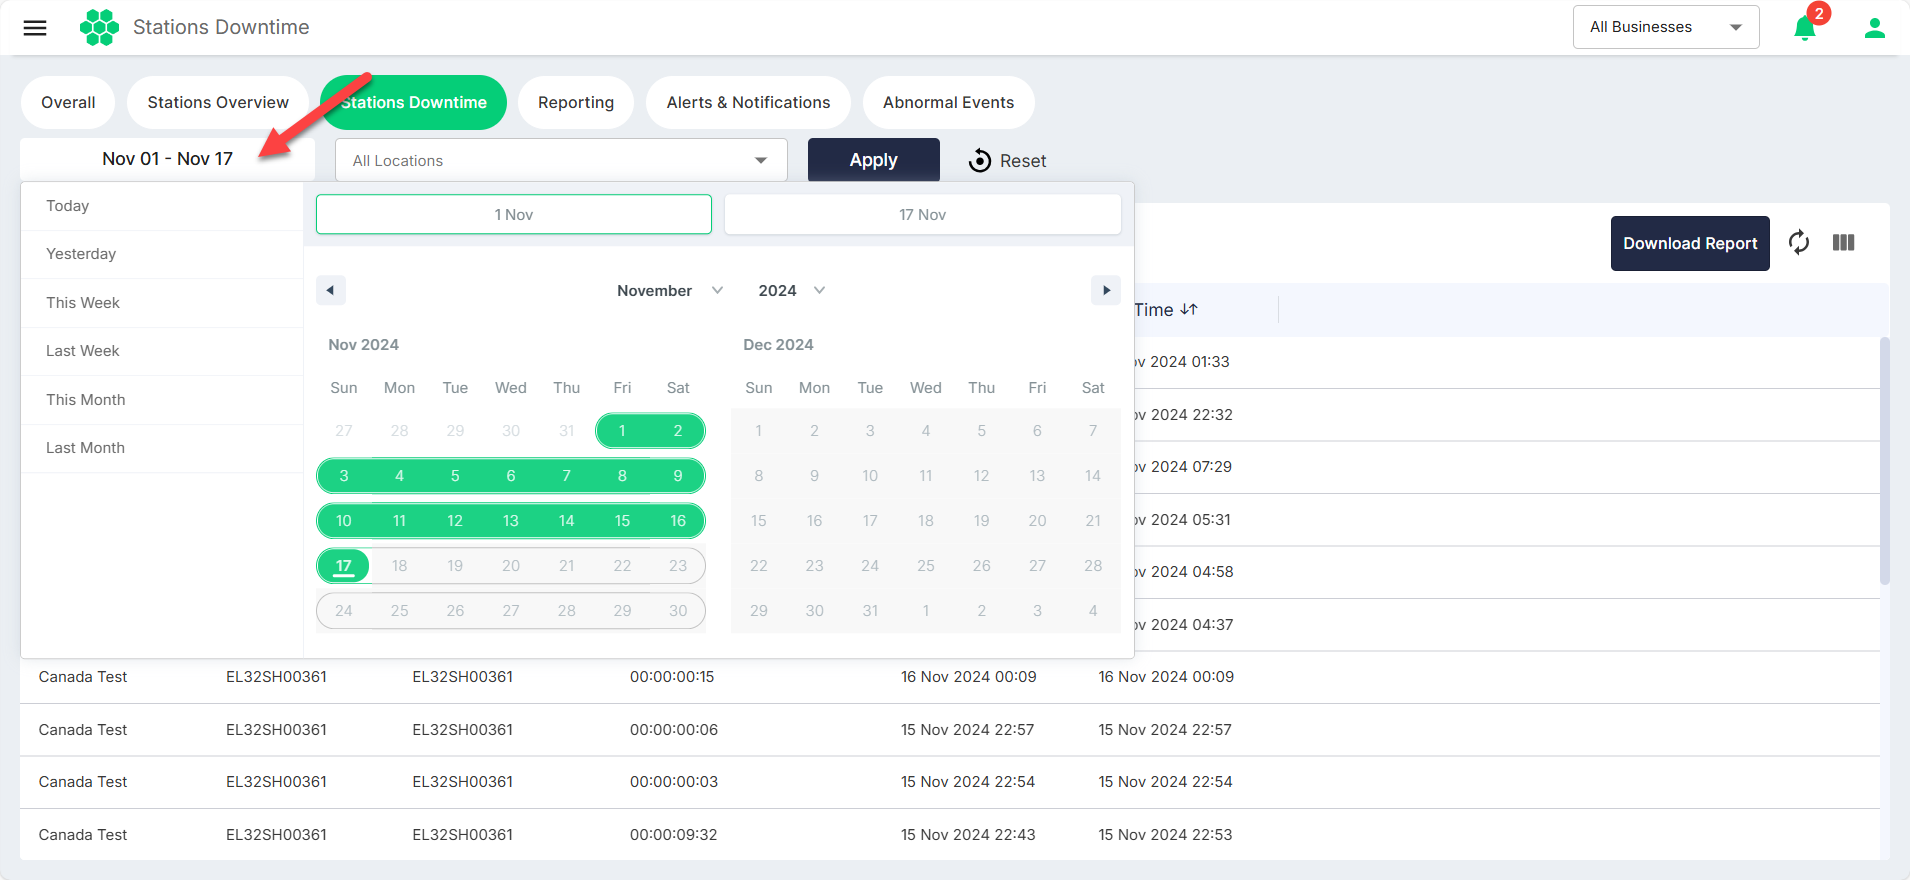
Select the displayed date range to open the calendar. The following predefined periods are available:
- Today
- Yesterday
- This Week
- Last Week
- This Month
- Last Month
- This Year
- Last Year
For a custom period, select the start and end dates in the two-month calendar. The month and year selectors can be used to move directly to an earlier period.
After changing the range, select the page-level Apply button to retrieve matching downtime records. The active period is displayed on the date-range control.
Location filter
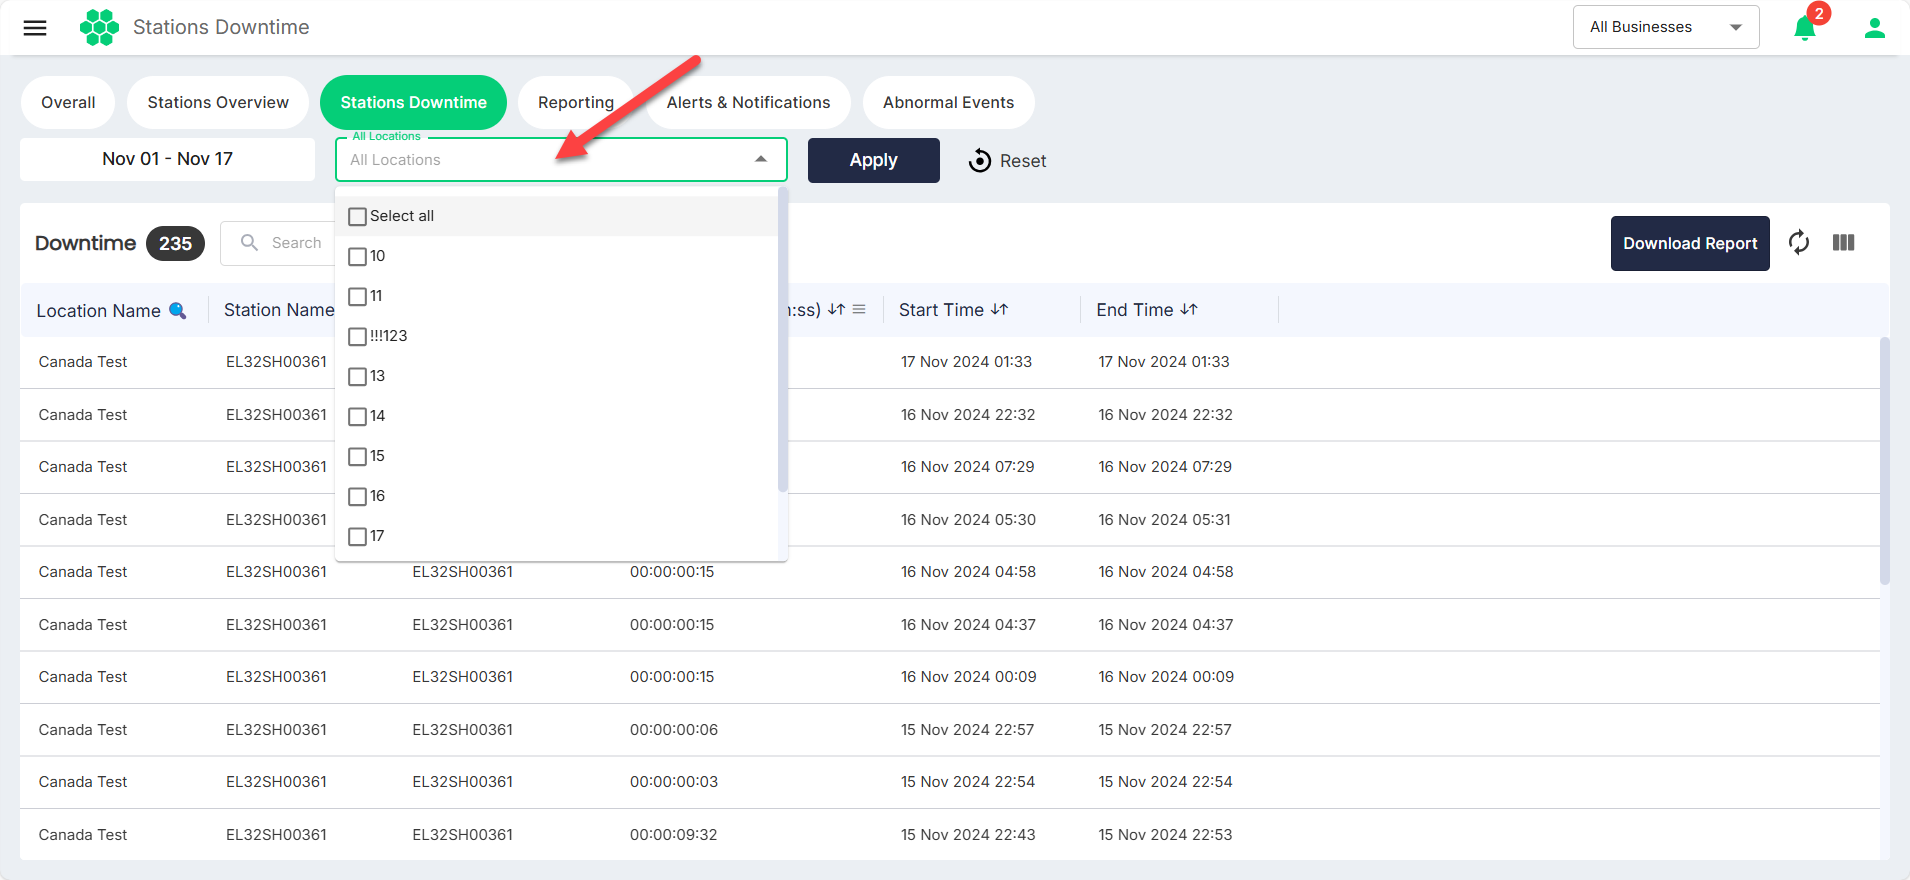
The All Locations selector limits the results to selected charging locations.
- Open the location selector.
- Type in the field to search for a location, or scroll through the available options.
- Select the checkbox beside each required location.
- Use Select all when every available location should be included.
- Select the page-level Apply button to update the results.
The selector supports multiple locations. Select Reset to clear the applied date and location criteria and return to the default page state.
Downtime summary
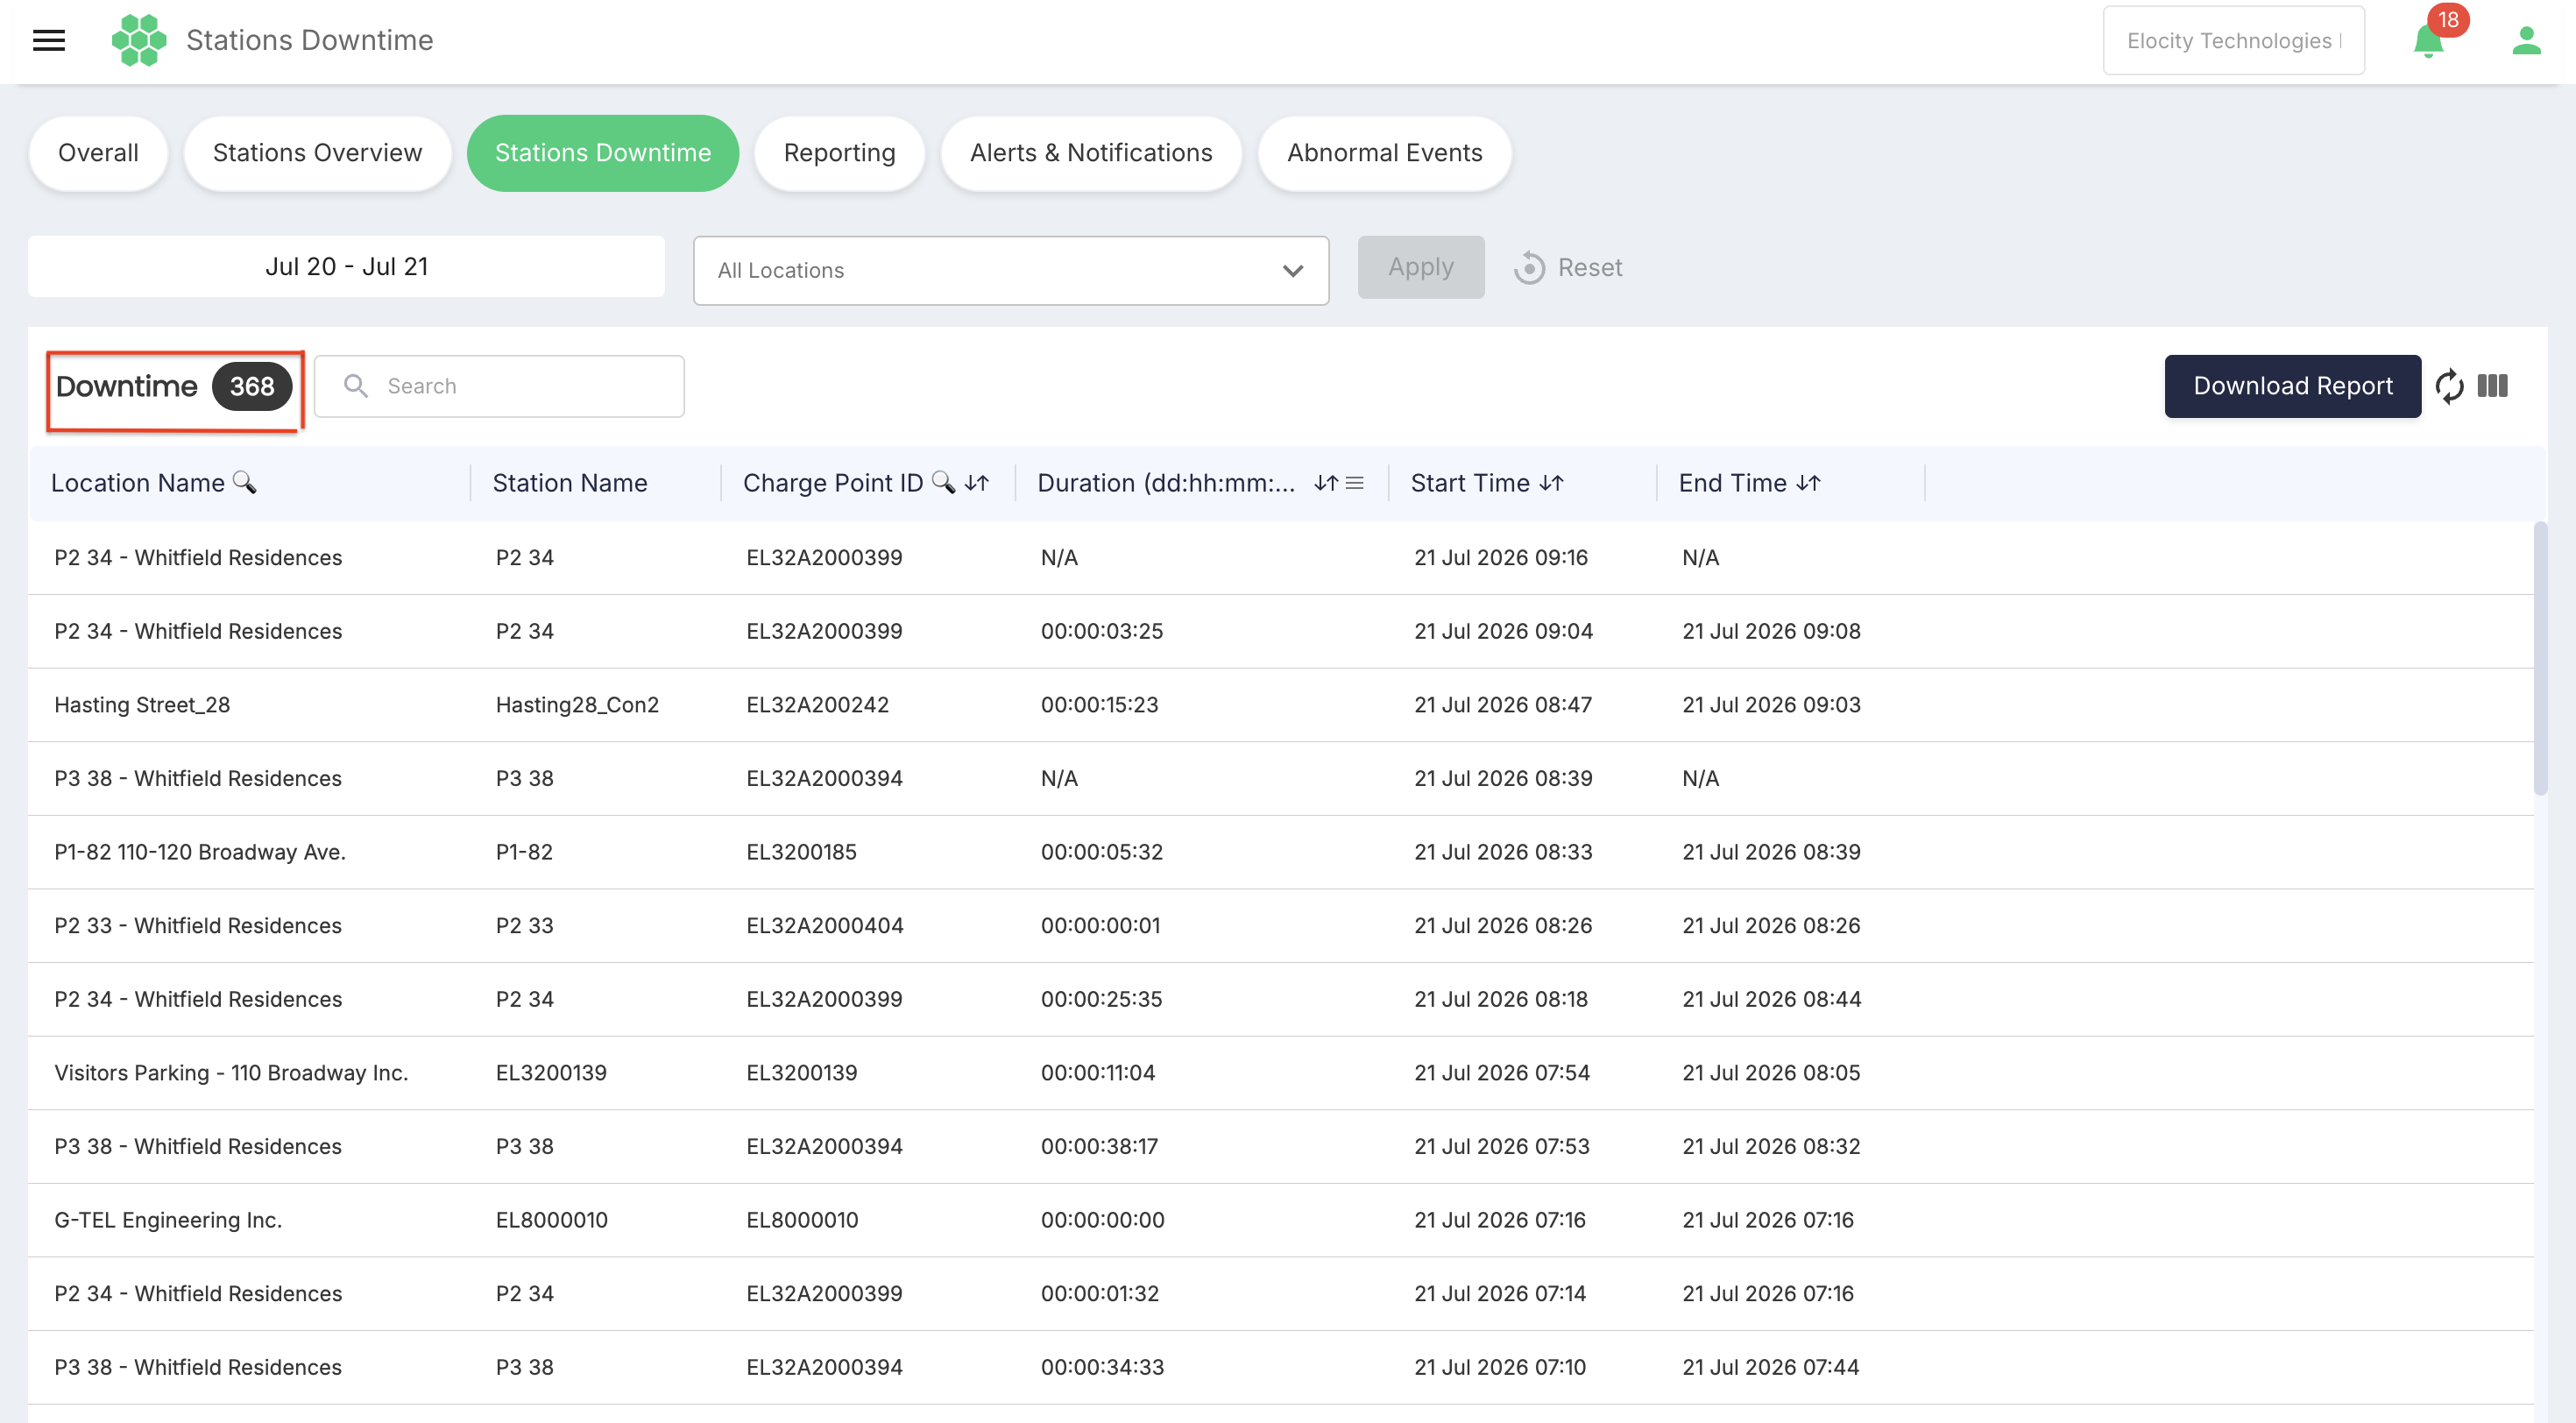
The Downtime counter shows the number of downtime records returned for the selected business, date range, and locations. It represents recorded disconnection events rather than a count of unique stations.
A station can therefore contribute more than one record when it disconnects multiple times during the selected period.
Grid search
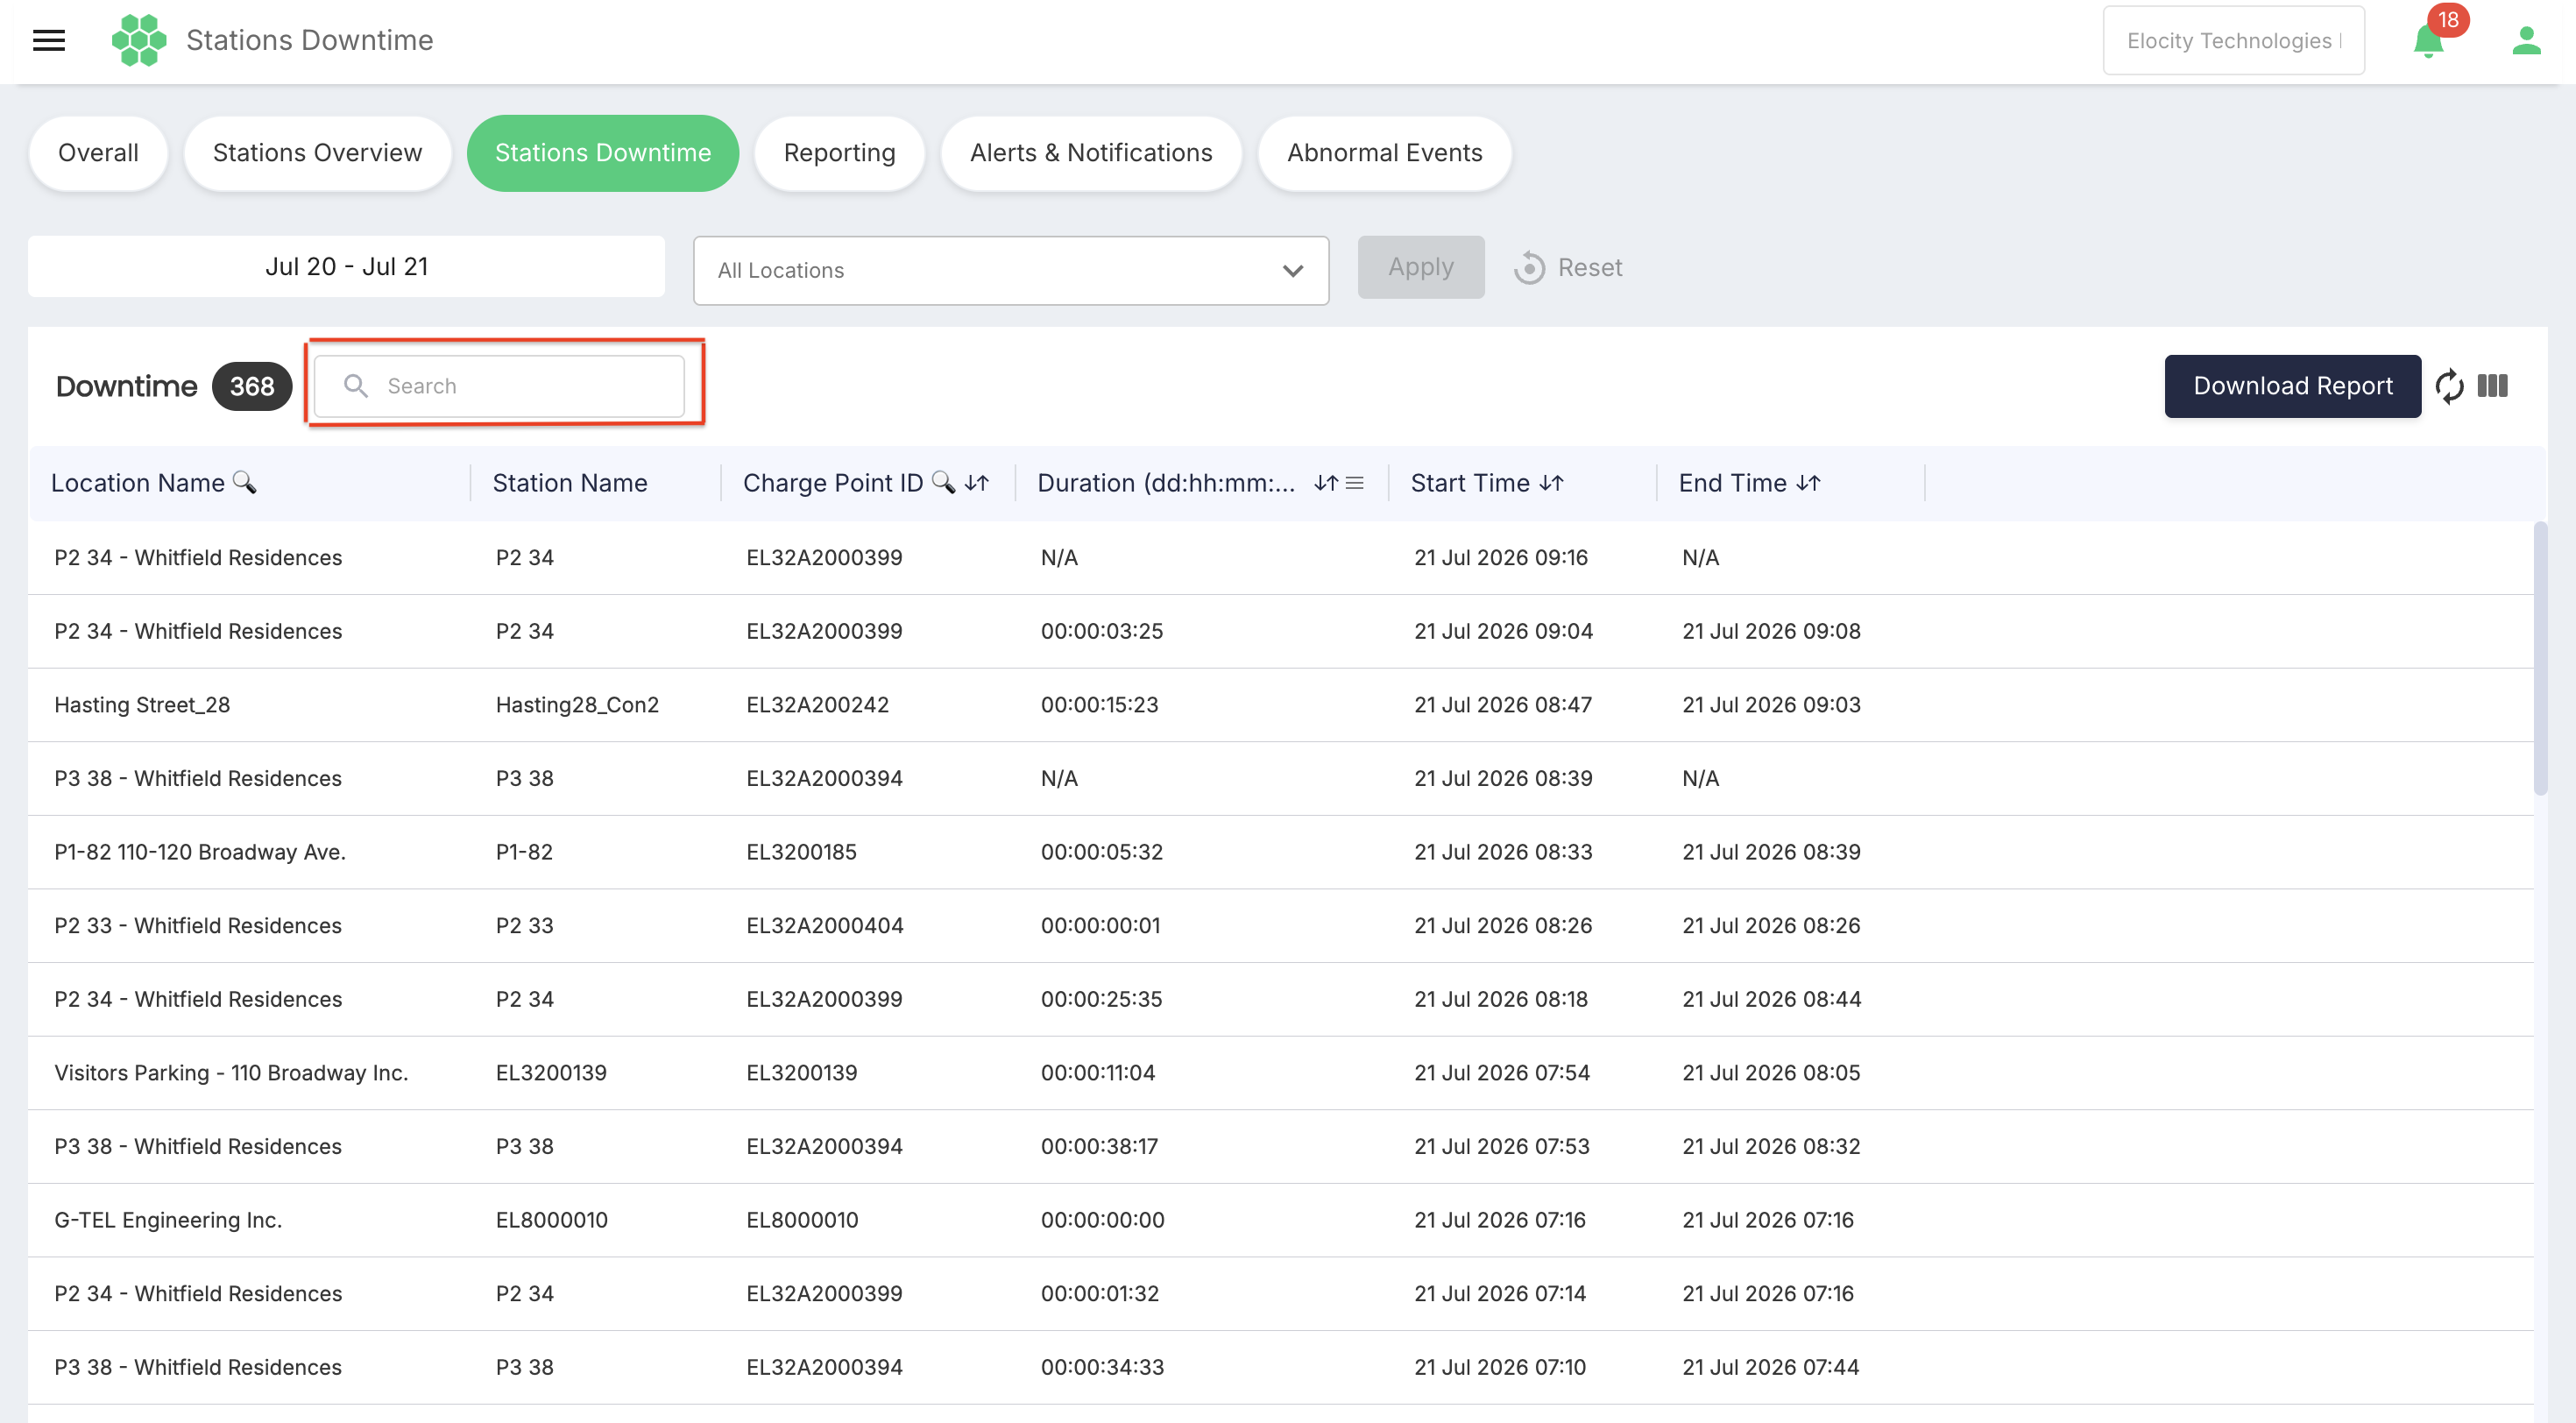
Use the Search field to filter the displayed downtime records. Search matches identifying information in the grid, including location name, station name, and Charge Point ID.
Search is applied to the current result set. Apply the required business, date, and location filters before using it to locate a specific record.
Clear the Search field to display the full filtered result set again.
Downtime grid
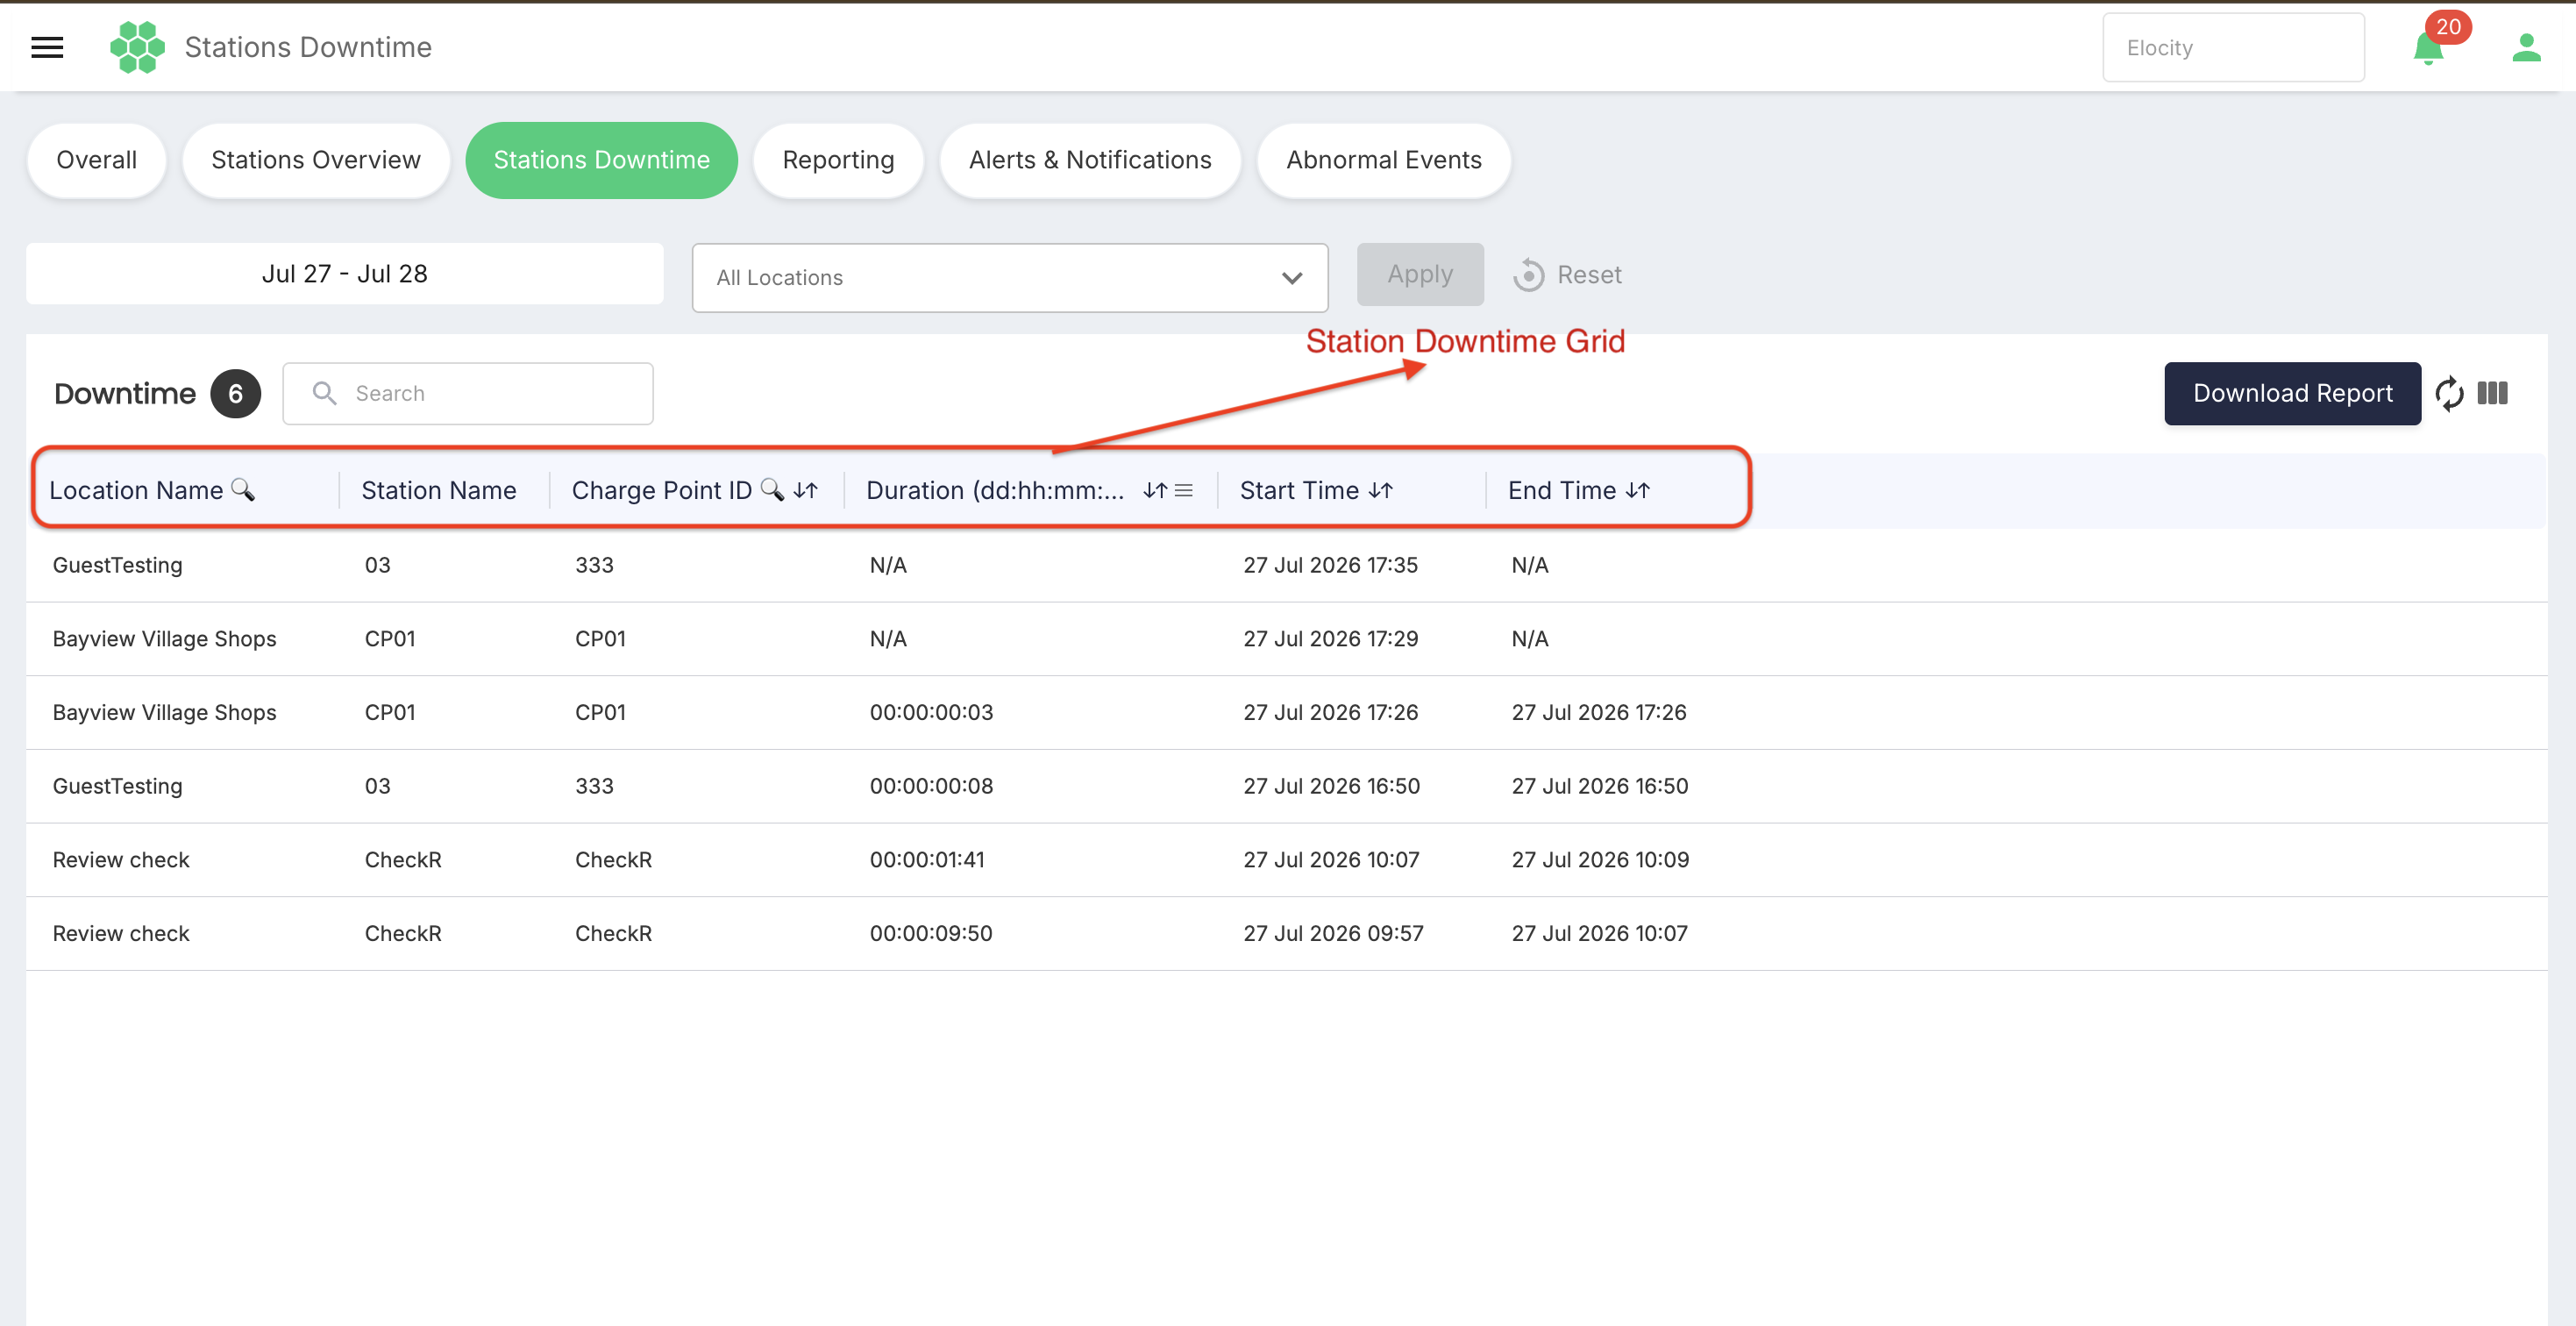
Each grid row represents one recorded station-disconnection event.
| Column | Description |
|---|---|
| Location Name | Identifies the charging location associated with the disconnected station. |
| Station Name | Shows the display name assigned to the affected station. |
| Charge Point ID | Shows the unique station identifier used for platform and OCPP communication. Use this value when correlating the event with station logs or support records. |
| Duration (dd:hh:mm:ss) | Shows the recorded disconnection duration in days, hours, minutes, and seconds. For example, 00:02:15:30 represents 0 days, 2 hours, 15 minutes, and 30 seconds. |
| Start Time | Shows when the platform recorded the beginning of the disconnection. |
| End Time | Shows when the platform recorded restoration of the station's network connection. |
Understanding unavailable values
N/A means that a value is not available for the record. When both Duration and End Time are unavailable, the disconnection may still be open or the closing information may not yet have been received. Refresh the data and verify the station's current status before drawing a conclusion.
A duration of 00:00:00:00 indicates that the recorded start and end times fall within the same displayed second. It does not necessarily mean that no disconnection occurred.
Sorting
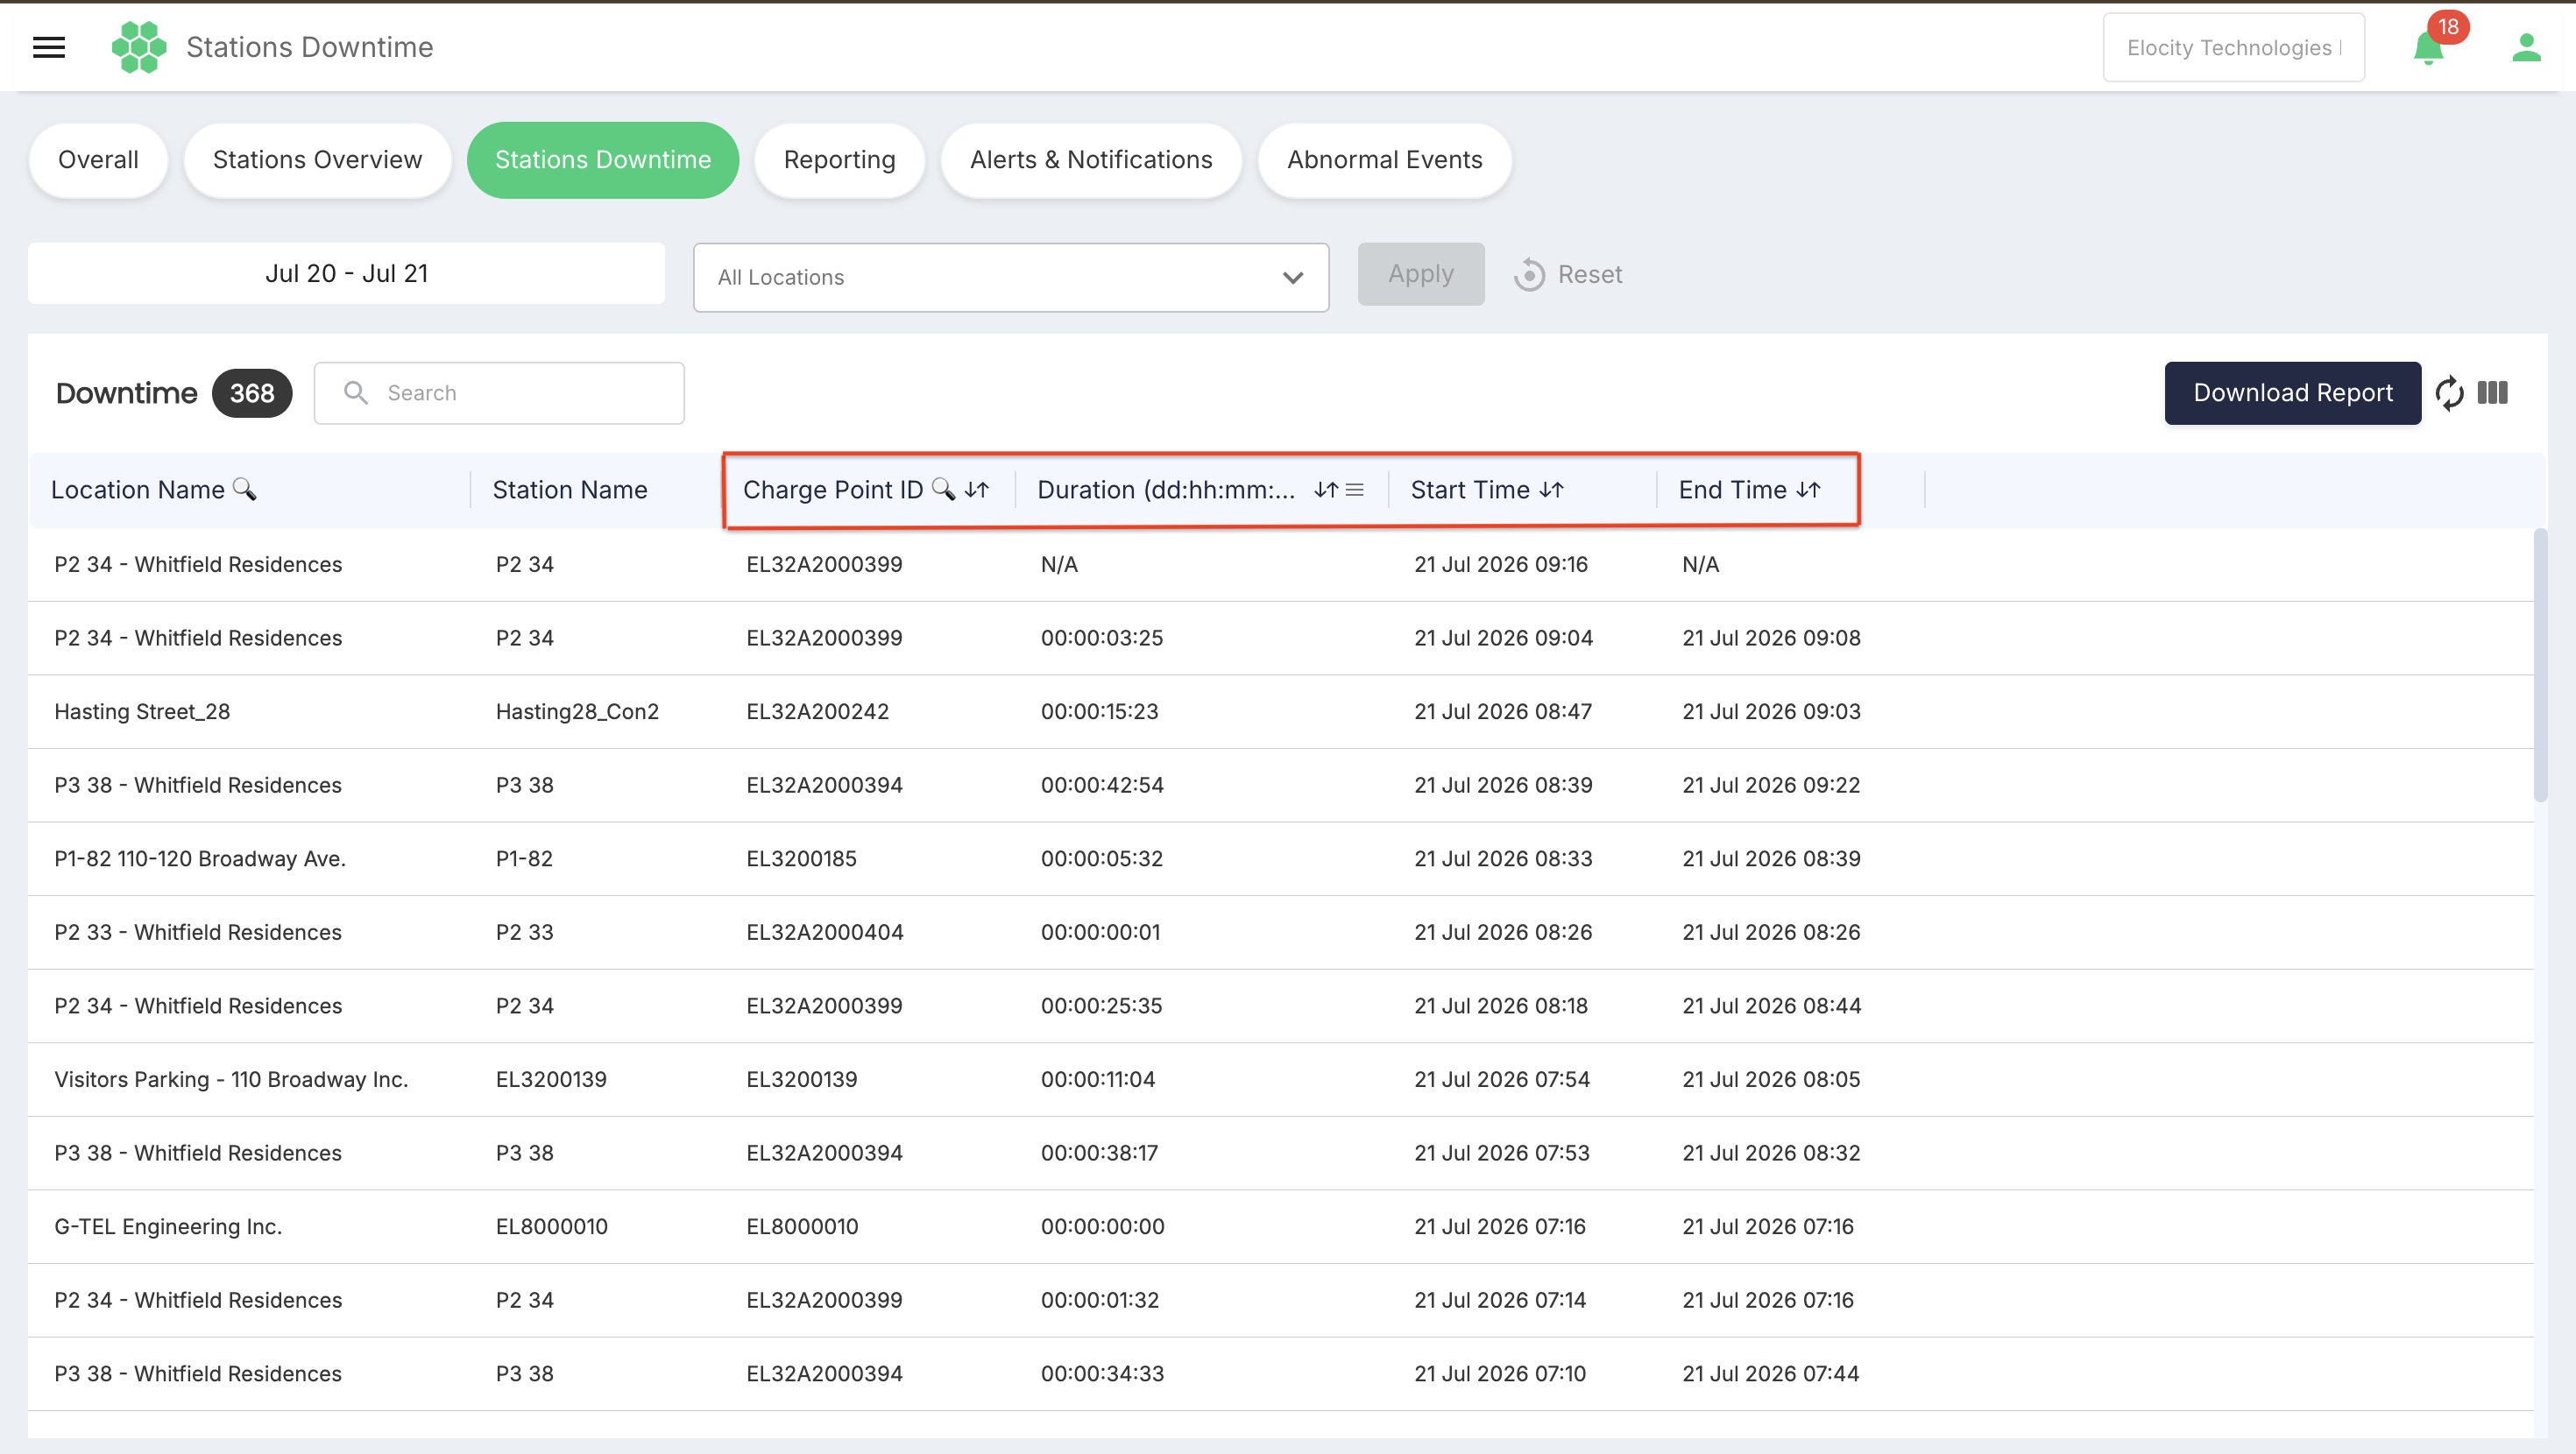
Supported column headers can be selected to change the result order. Sorting is available for fields such as:
- Charge Point ID
- Duration
- Start Time
- End Time
Select a sortable header again to change between ascending and descending order.
Filtering by duration
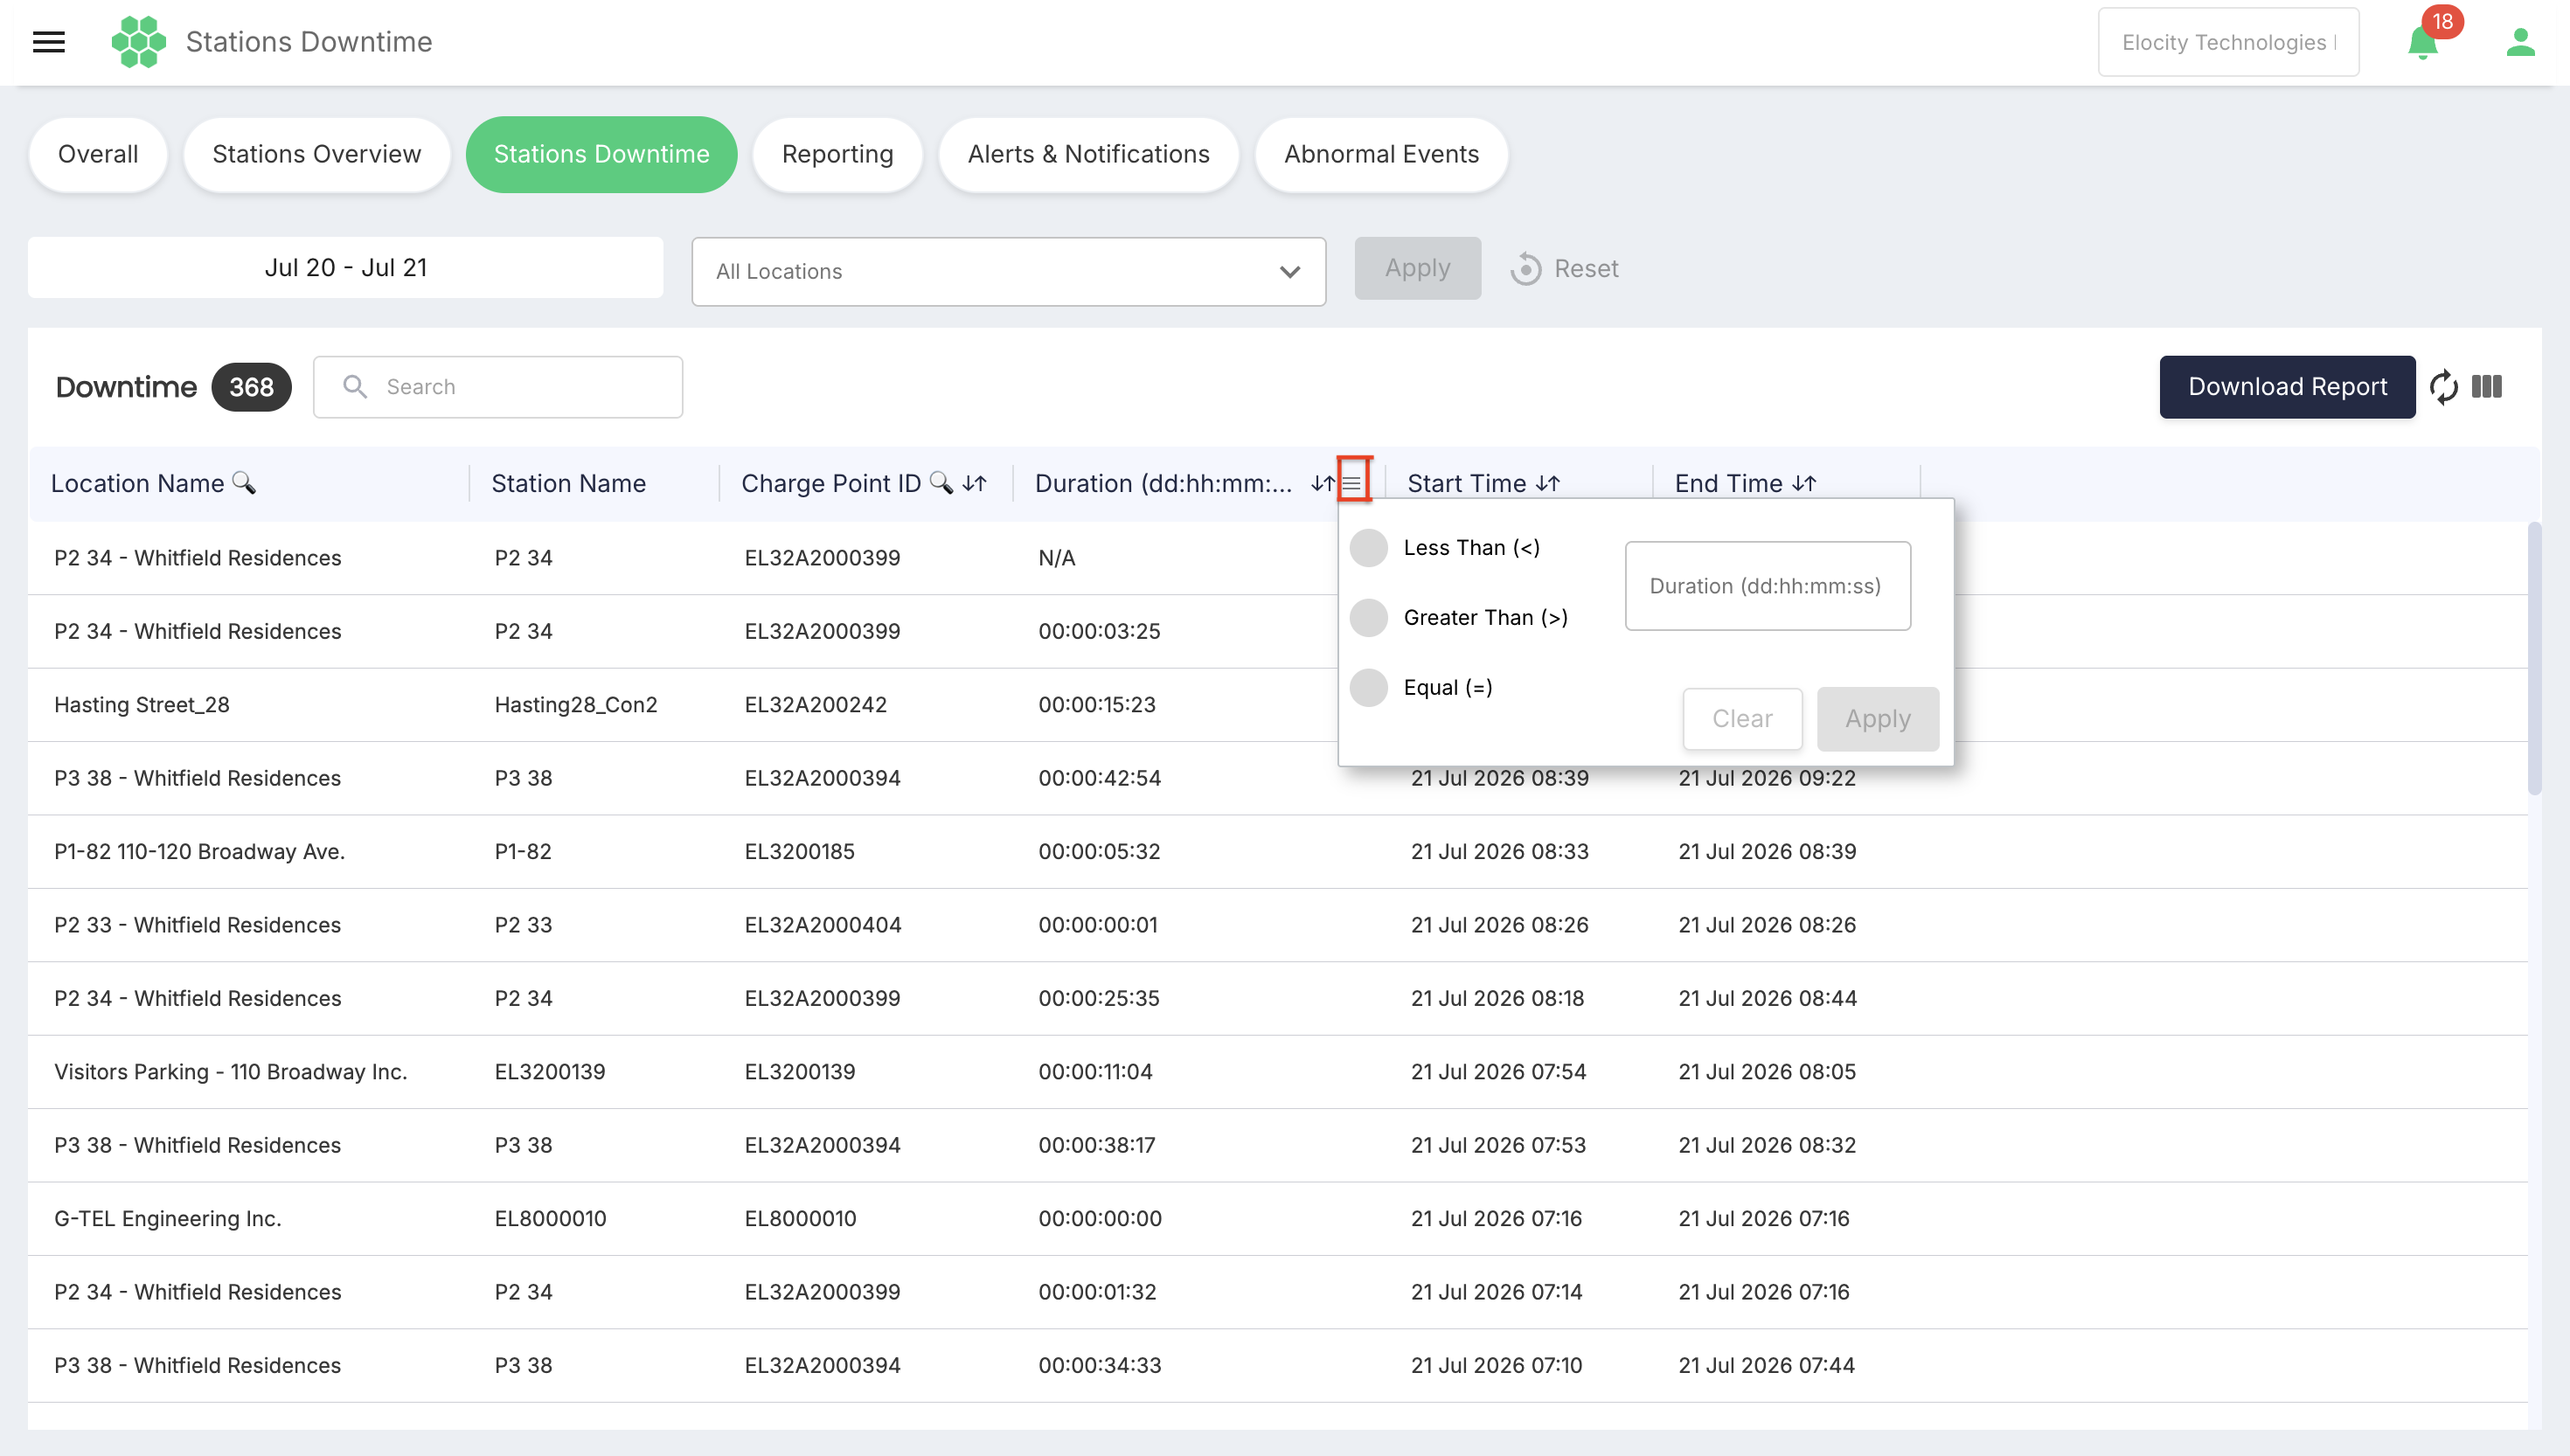
Open the menu in the Duration (dd:hh:mm:ss) column to filter events by a specific duration. The available comparisons are:
- Less Than (
<) - Greater Than (
>) - Equal (
=)
Enter the comparison value in dd:hh:mm:ss format and select Apply. Select Clear to remove the duration condition.
This feature is useful for isolating prolonged outages or excluding brief connection interruptions.
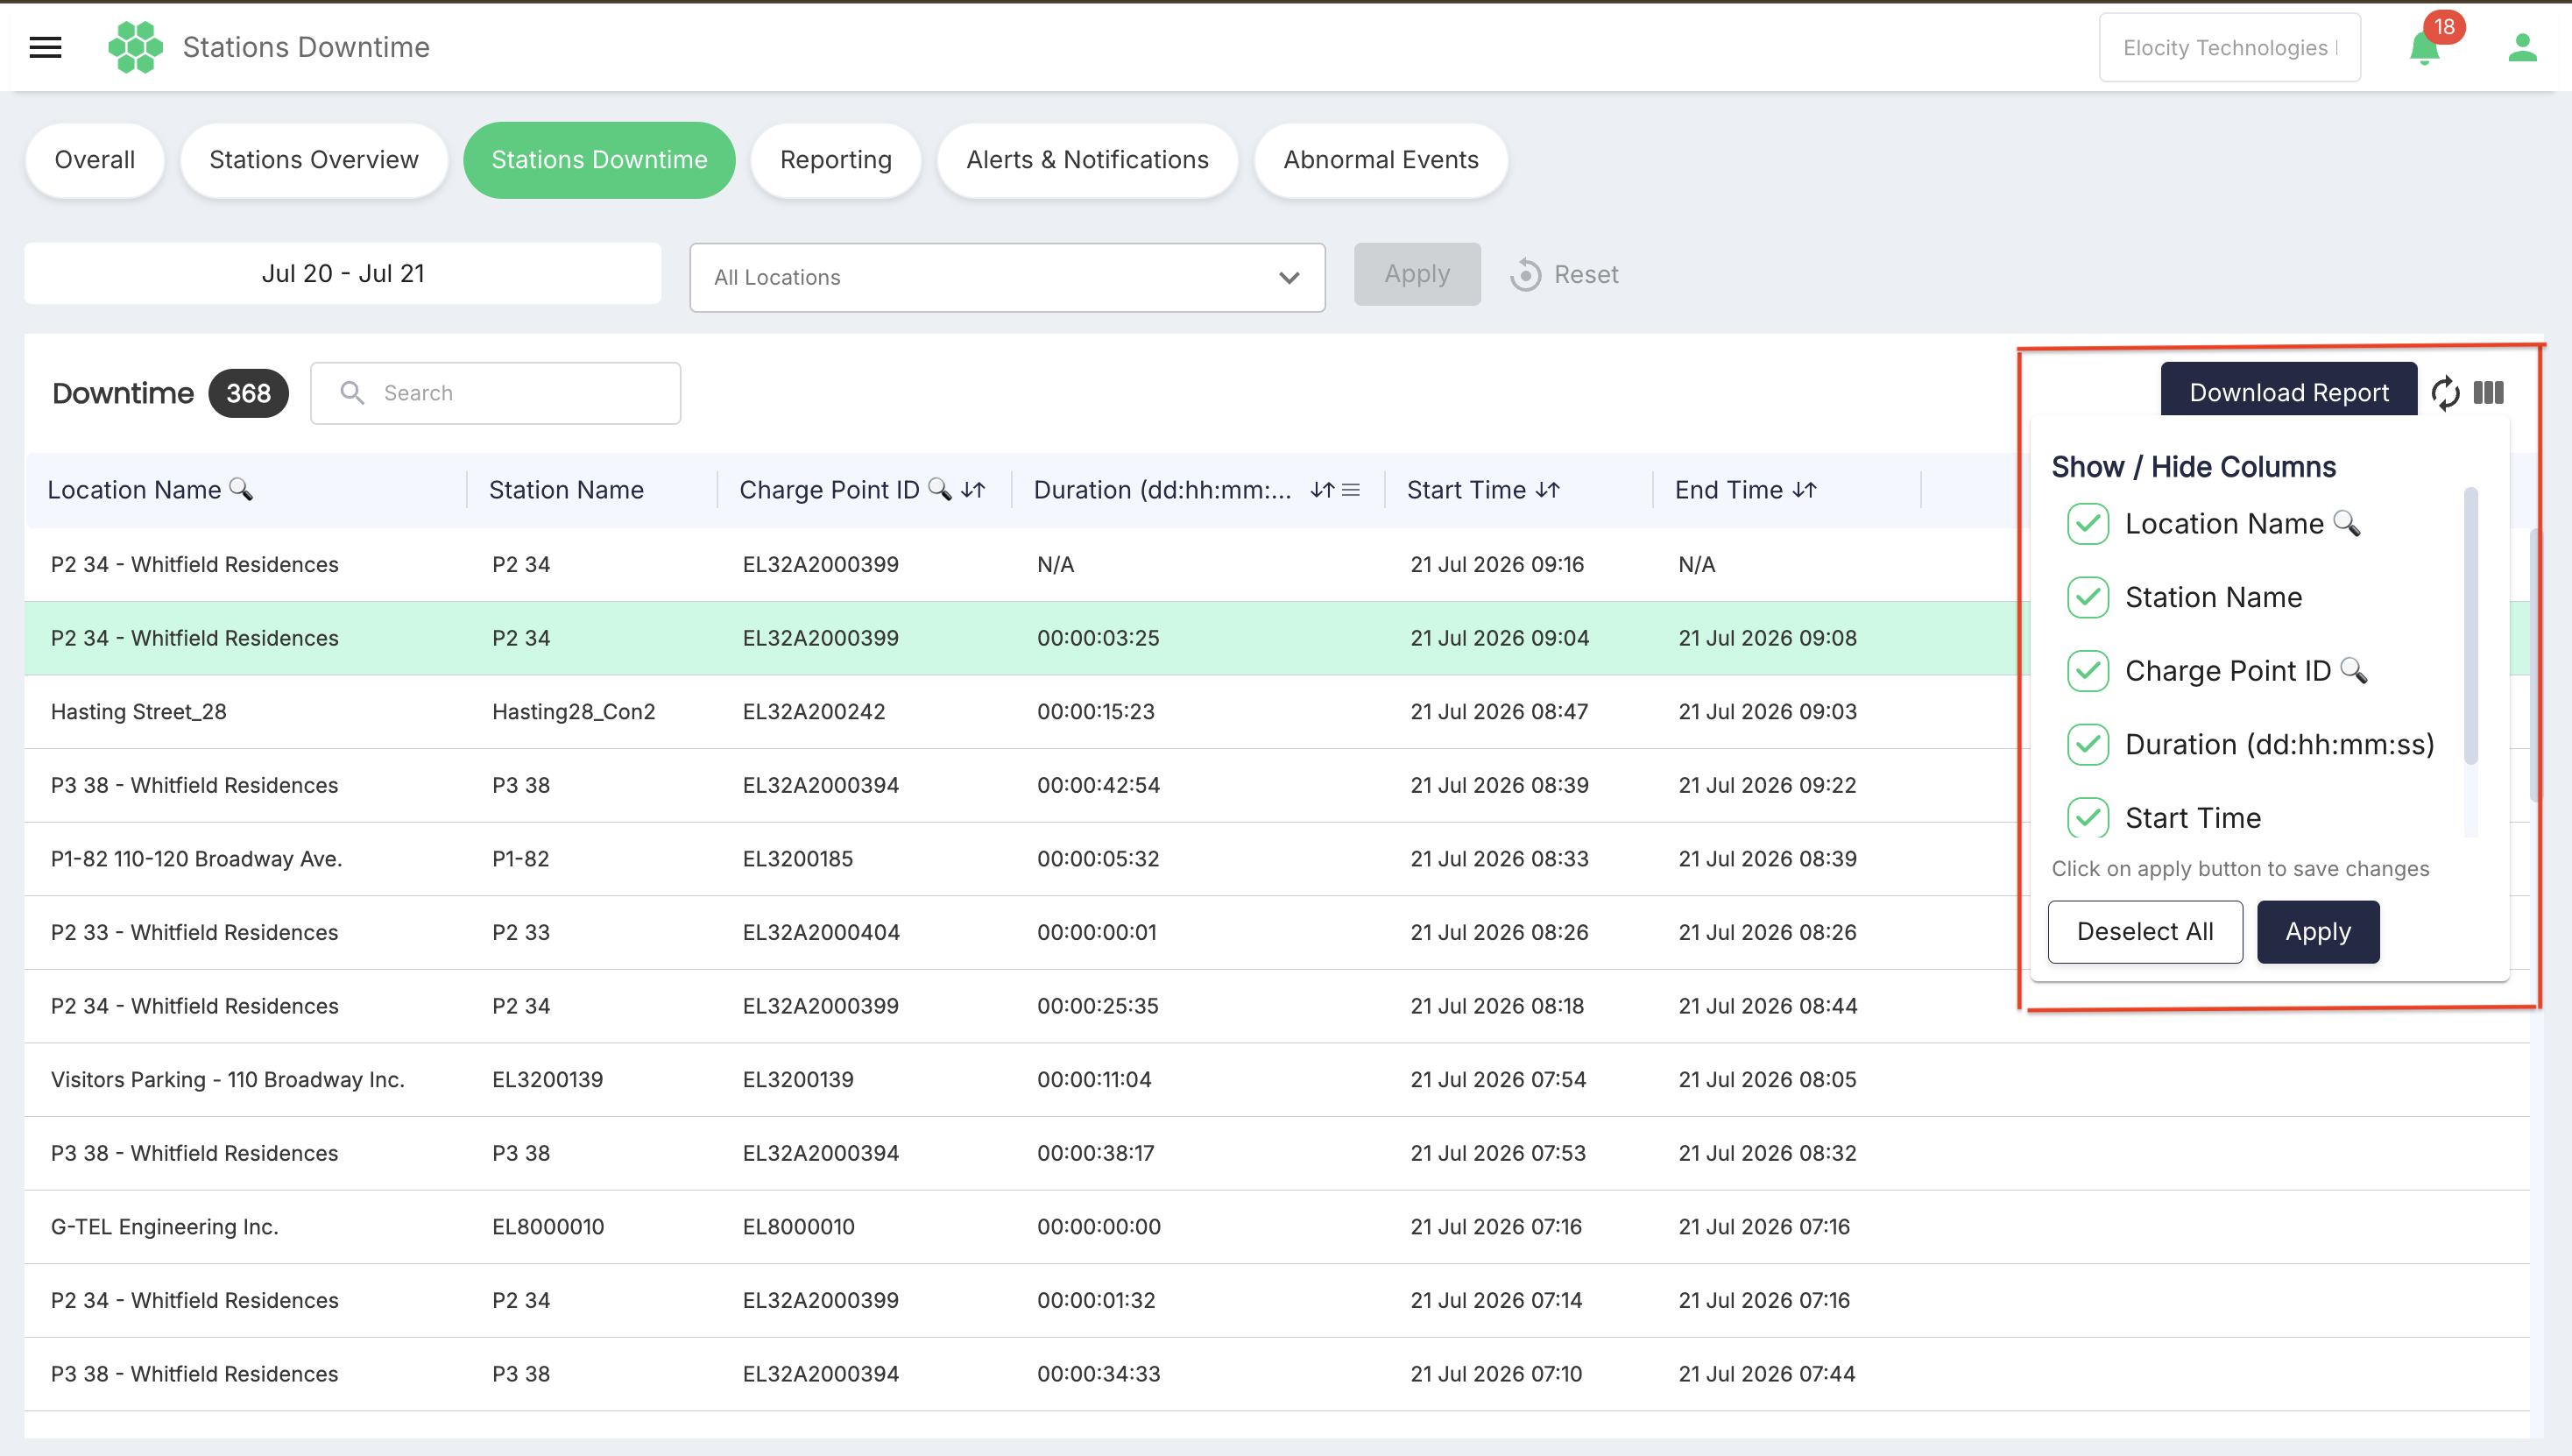
Showing and hiding columns
Select Column Filter to open the Show / Hide Columns menu. The following columns can be shown or hidden:
- Location Name
- Station Name
- Charge Point ID
- Duration (dd:hh:mm:ss)
- Start Time
- End Time
Select or clear the checkbox beside a column, then select Apply inside the column menu to save the grid layout. Deselect All clears all column selections.
Column visibility changes the on-screen layout; it does not change the underlying downtime records.
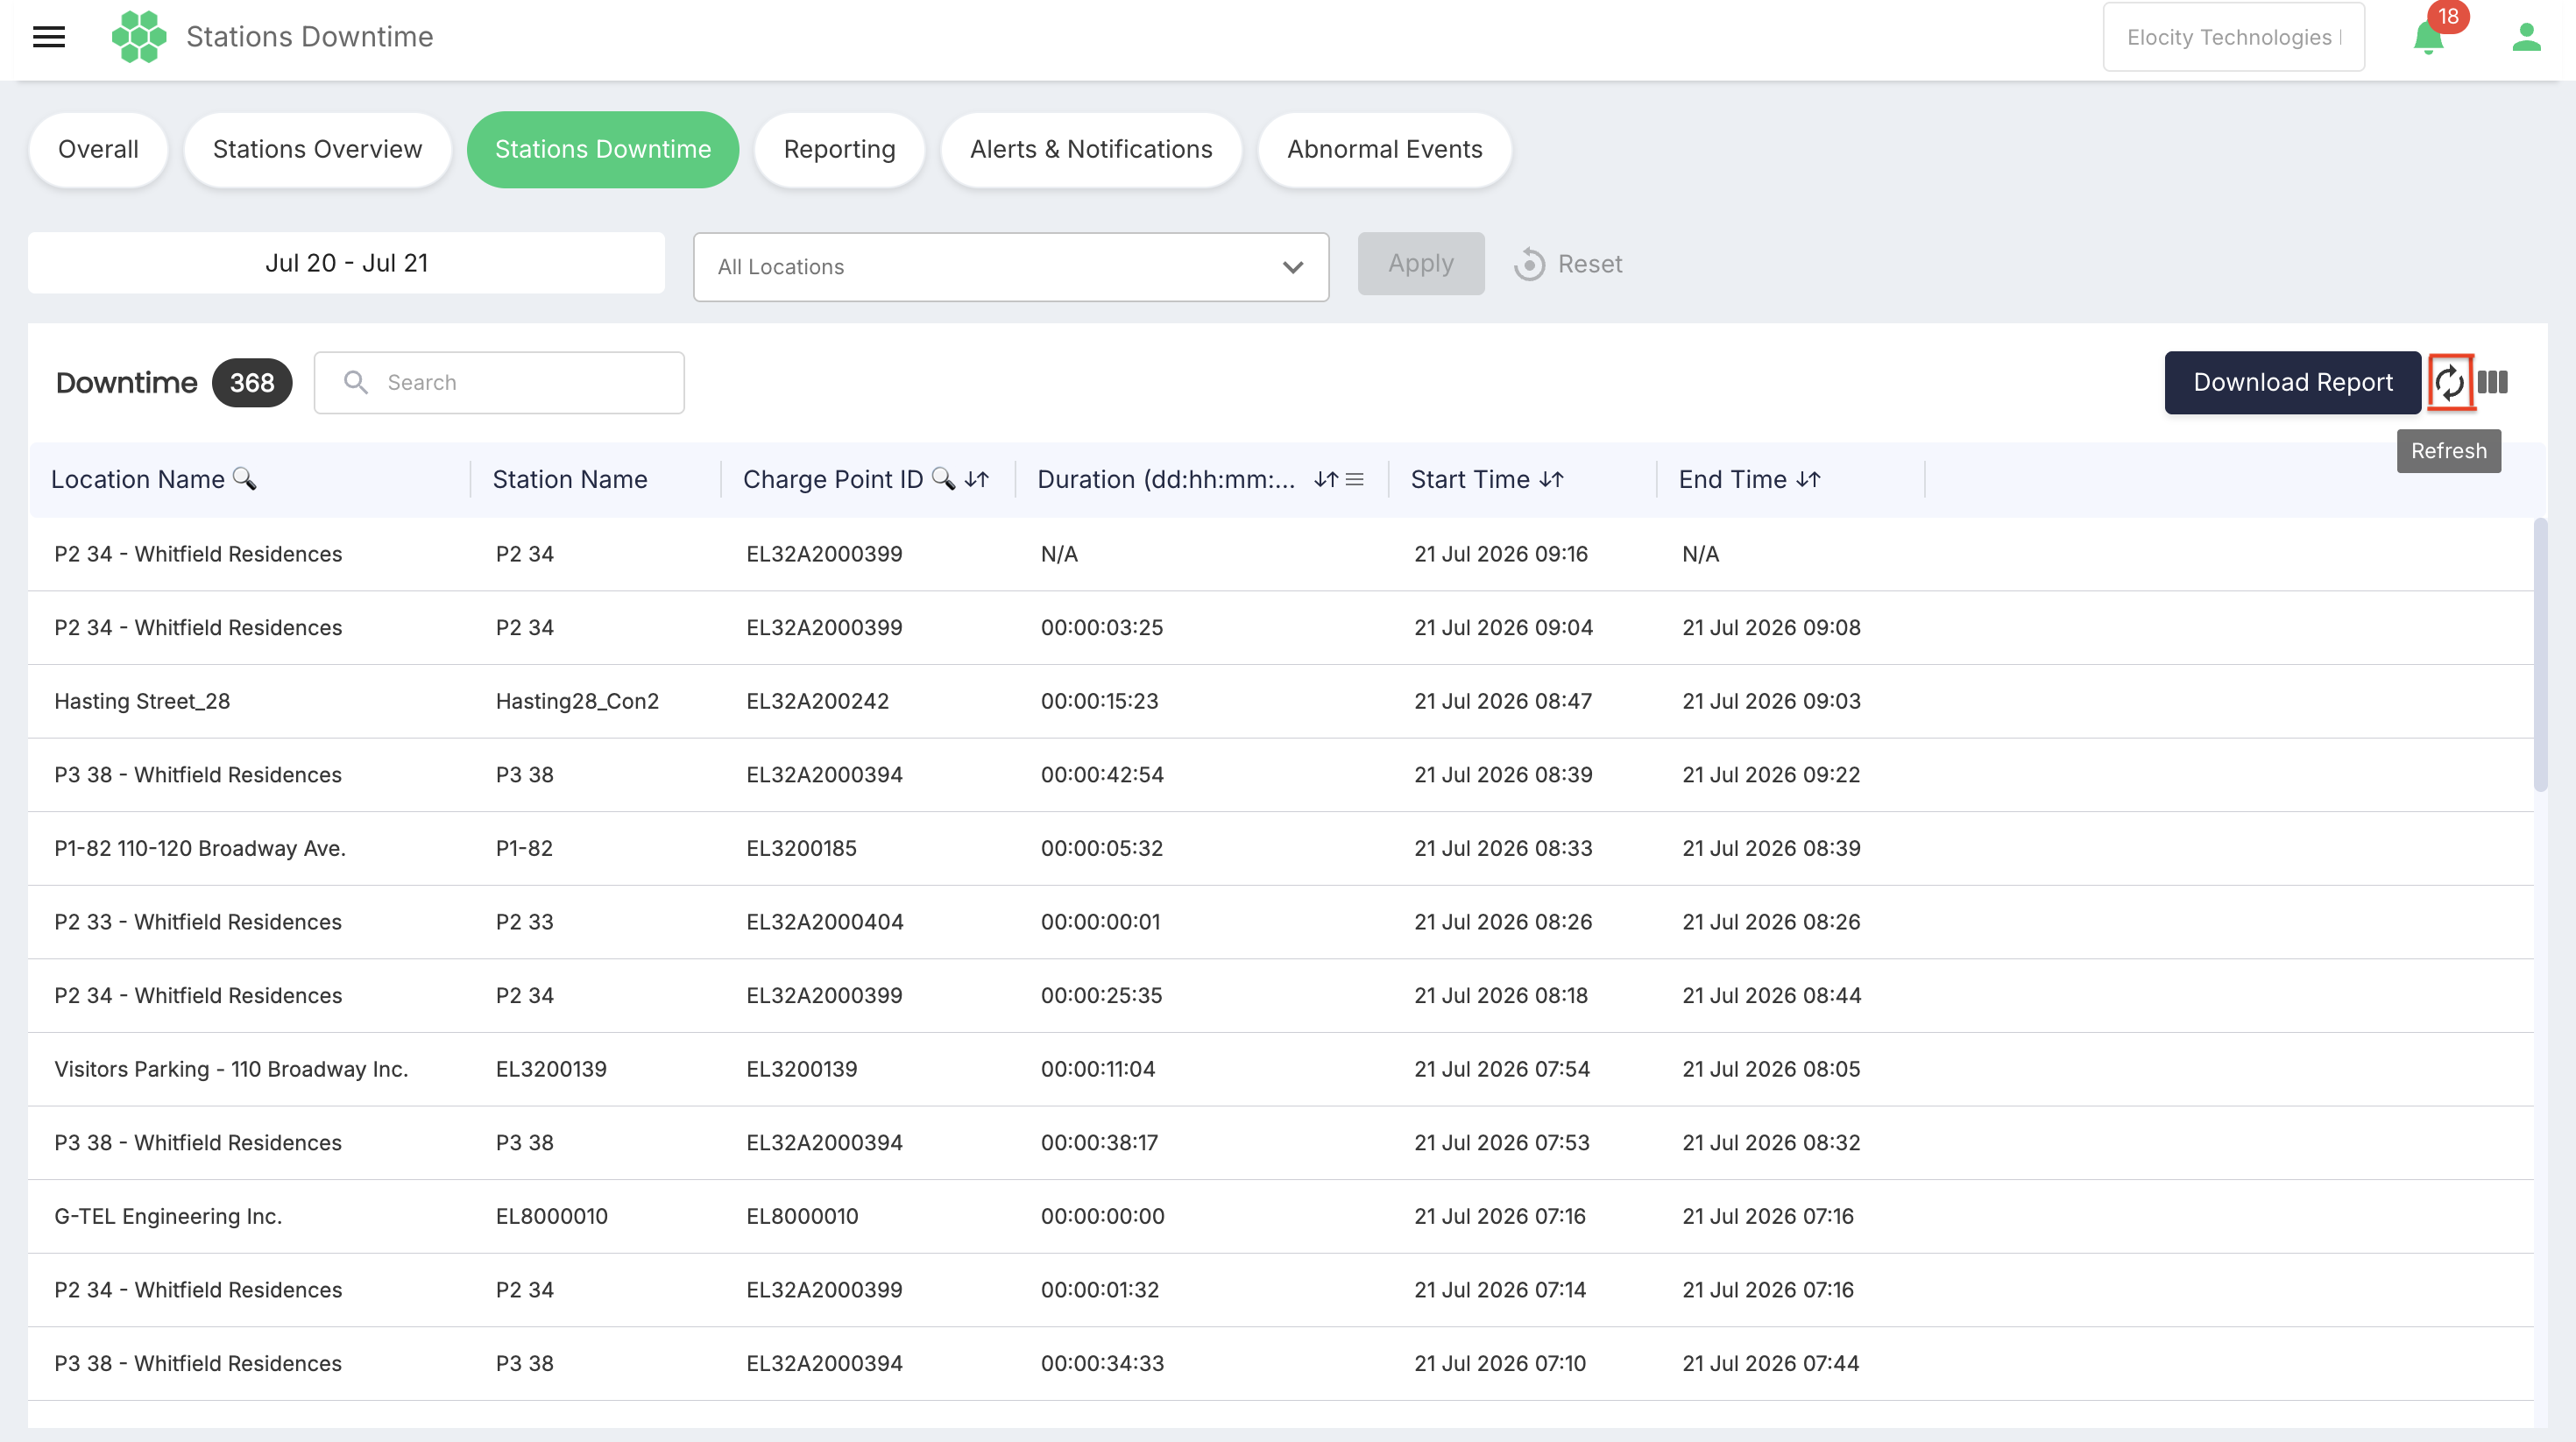
Refreshing the data
Select Refresh to request the latest available downtime information. Refresh before investigating an event with no end time or before confirming that a station remains disconnected.
After refreshing, confirm that the intended business and filter selections are still displayed before continuing the investigation.
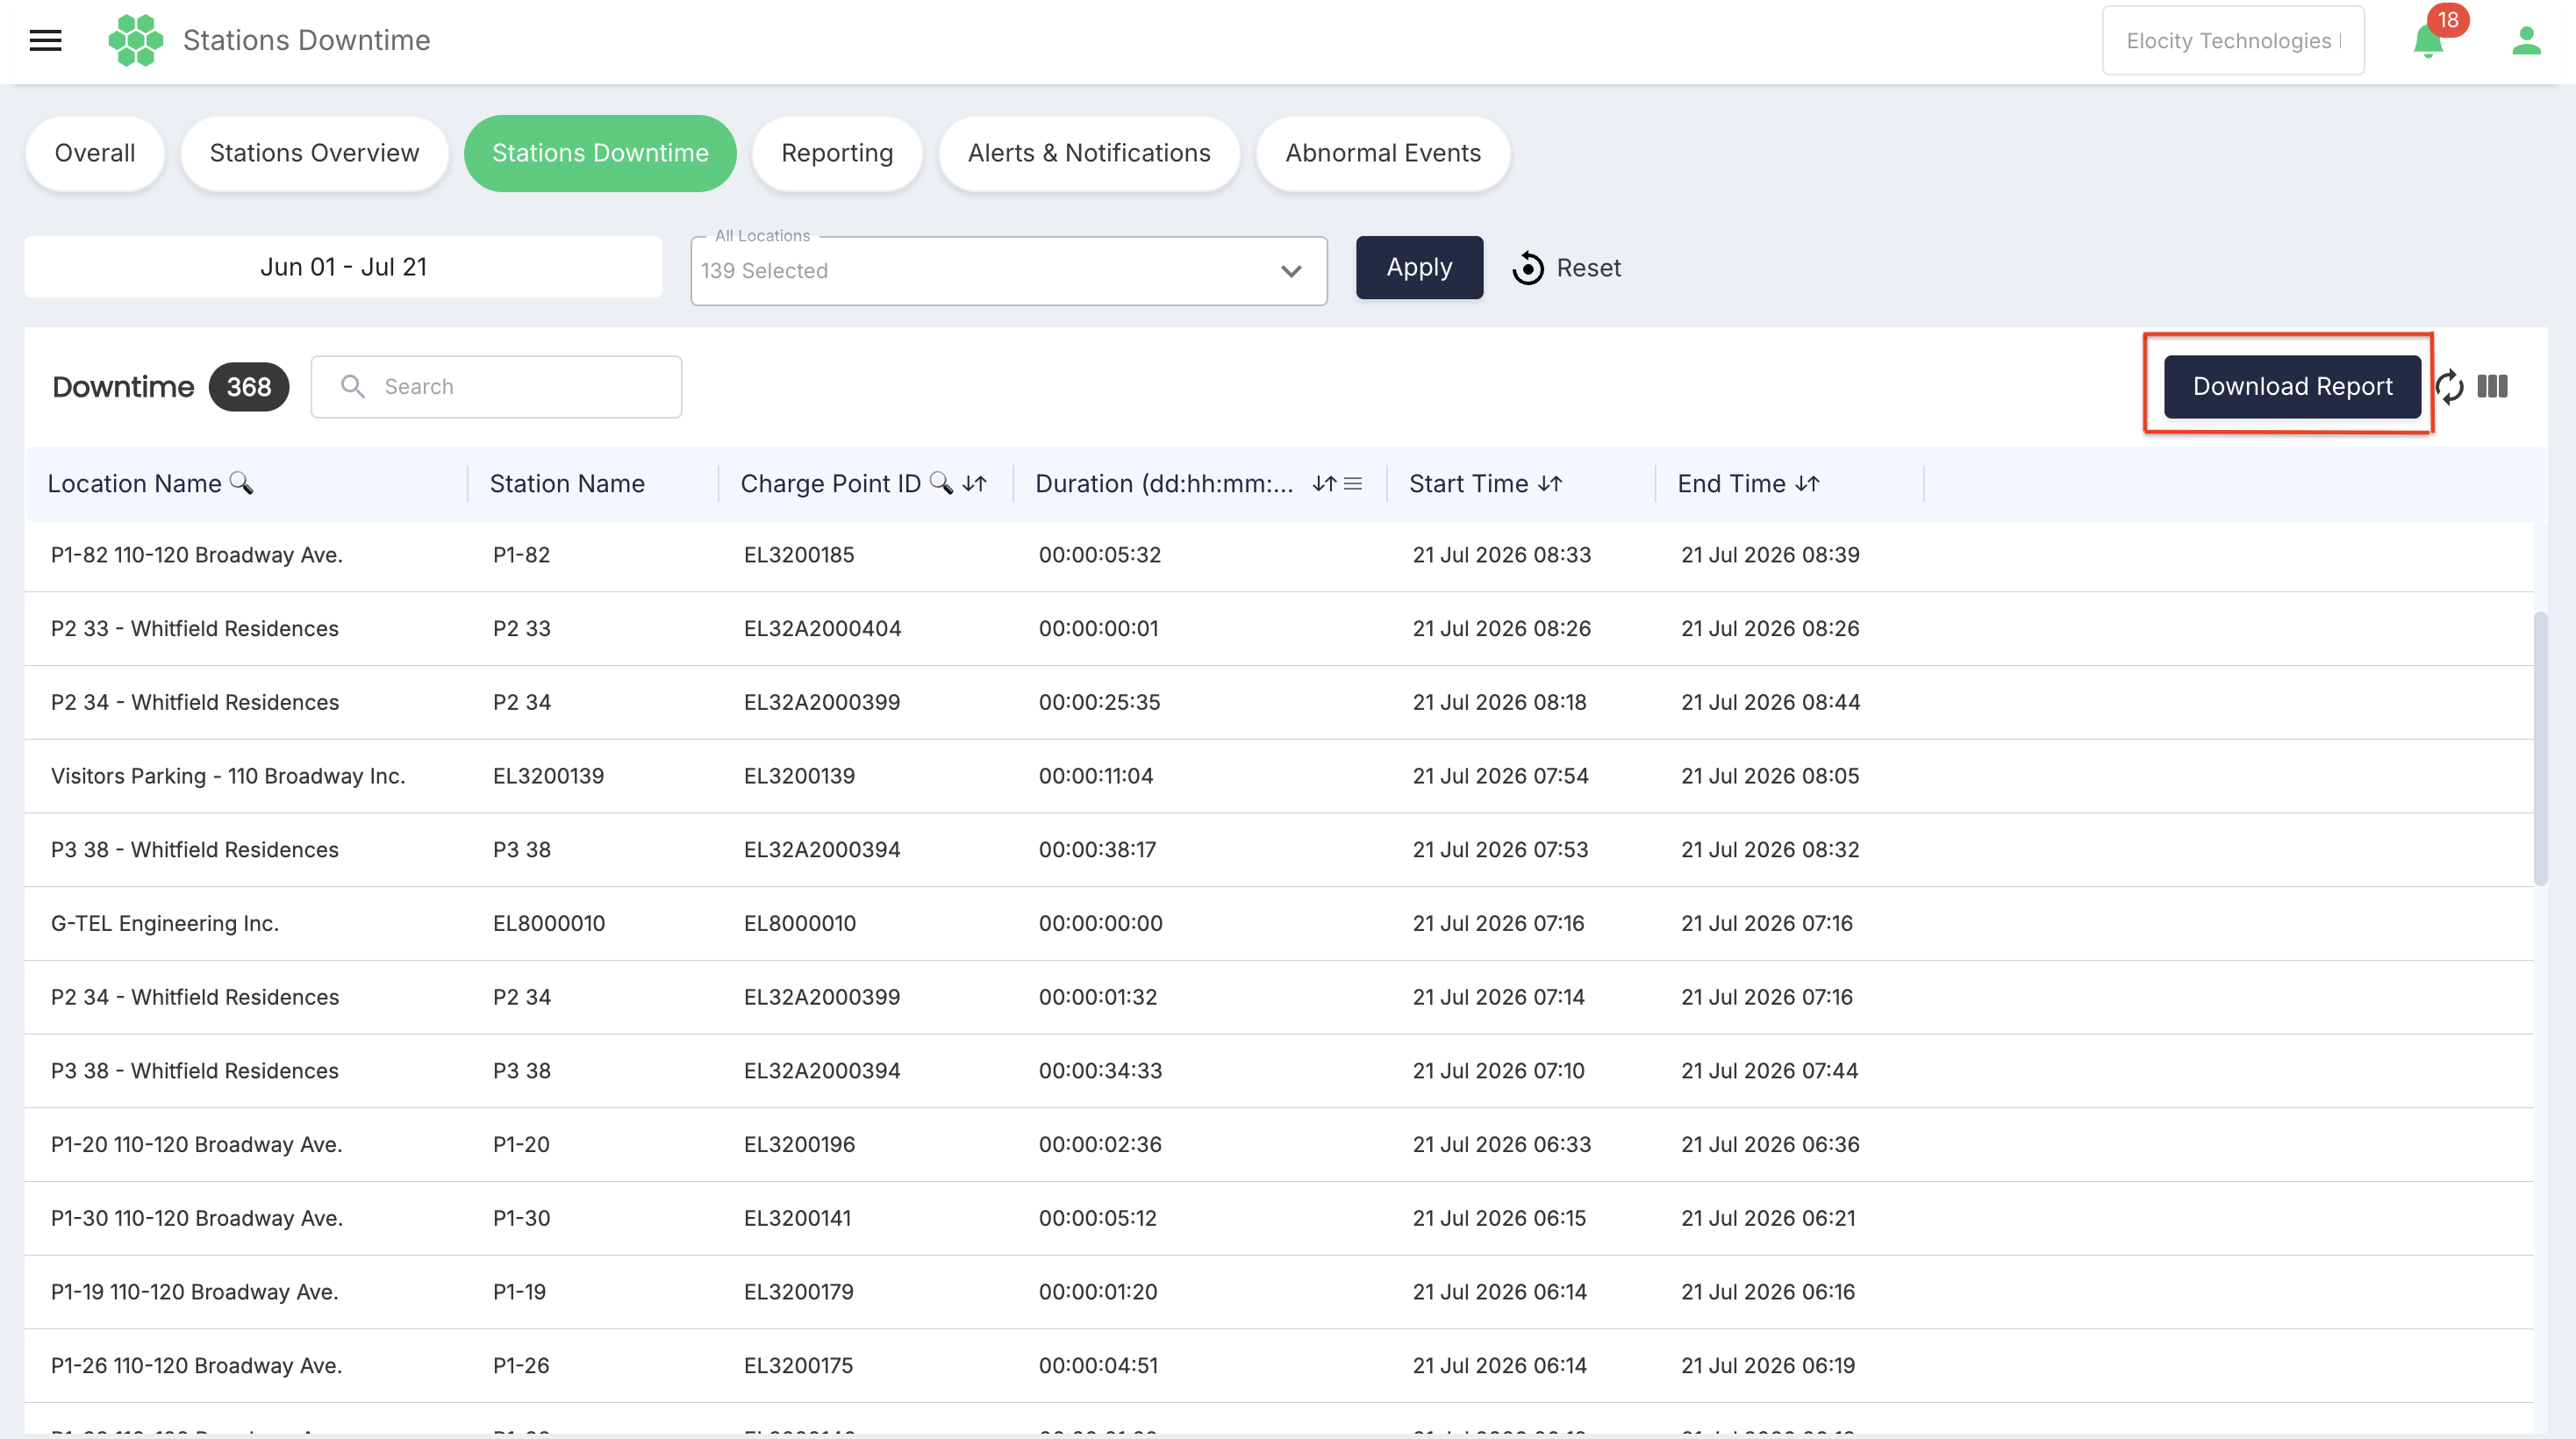
Downloading the report
Select Download Report to export the station-downtime data for offline analysis or operational record keeping.
Before downloading:
- Confirm the selected business.
- Set the required date range.
- Select the required locations.
- Select Apply.
- Review the Downtime counter and visible records.
- Select Download Report.
The page does not identify the report format on the button itself; check the downloaded file before forwarding or importing it into another system.
Handle exported records in accordance with the organization's data-retention and sharing policies.
Recommended investigation workflow
- Select the affected business.
- Choose the incident period using a preset or custom date range.
- Select the reported location or locations.
- Select Apply and review the Downtime counter.
- Search for the station name or Charge Point ID.
- Sort by Start Time to reconstruct the event sequence, or by Duration to prioritize the longest disconnections.
- Apply a duration comparison when only events above or below a defined threshold are relevant.
- Review records with an unavailable End Time to identify potentially open disconnections.
- Select Refresh and verify the current station state in Stations Overview.
- Correlate the Charge Point ID and timestamps with station OCPP logs before assigning a root cause.
- Select Download Report when the filtered records must be retained or shared with an authorized support team.
Interpretation notes
- Downtime measures recorded network disconnections; it does not by itself identify the technical cause.
- Possible causes can include loss of power, loss of network connectivity, station restart, communication interruption, configuration problems, or hardware failure. Confirm the cause from supporting evidence.
- Multiple short records for the same Charge Point ID can indicate intermittent connectivity or repeated reconnect attempts.
- Times are displayed according to the portal's configured time handling. Confirm the applicable timezone when comparing them with external systems.
- A station that appears in historical downtime records may currently be online.
- A missing end time should be treated as requiring verification, not automatic proof of an active hardware failure.
- Totals can differ between users because of business assignments and permissions.