Dashboard Overview (Overall)
Purpose
The Overall dashboard provides a consolidated, real-time view of EV charging network performance. It brings together asset availability, charging activity, energy consumption, revenue, utilization, driver engagement, and operational exceptions so that authorized users can quickly assess network health and identify areas that require attention.
Dashboard values refresh as operational data is received. The information displayed depends on the selected business, reporting period, and the user's access permissions.

Accessing the page
- Sign in to the HIEV portal.
- Open Dashboard from the main navigation.
- Select the Overall tab.
Dashboard navigation
Use the tabs at the top of the page to move between dashboard views:
- Overall — Displays the network-wide operational and performance summary described on this page.
- Stations Overview — Provides a more detailed view of charging-station status and performance.
- Stations Downtime — Presents station unavailability and downtime information.
- Reporting — Provides access to dashboard reports and reporting controls.
- Alerts & Notifications — Displays operational alerts and notifications that may require review.
- Abnormal Events — Lists exceptional or abnormal charging-network events for investigation.
Each of these views should be documented as a separate user-manual page.
Page controls
-
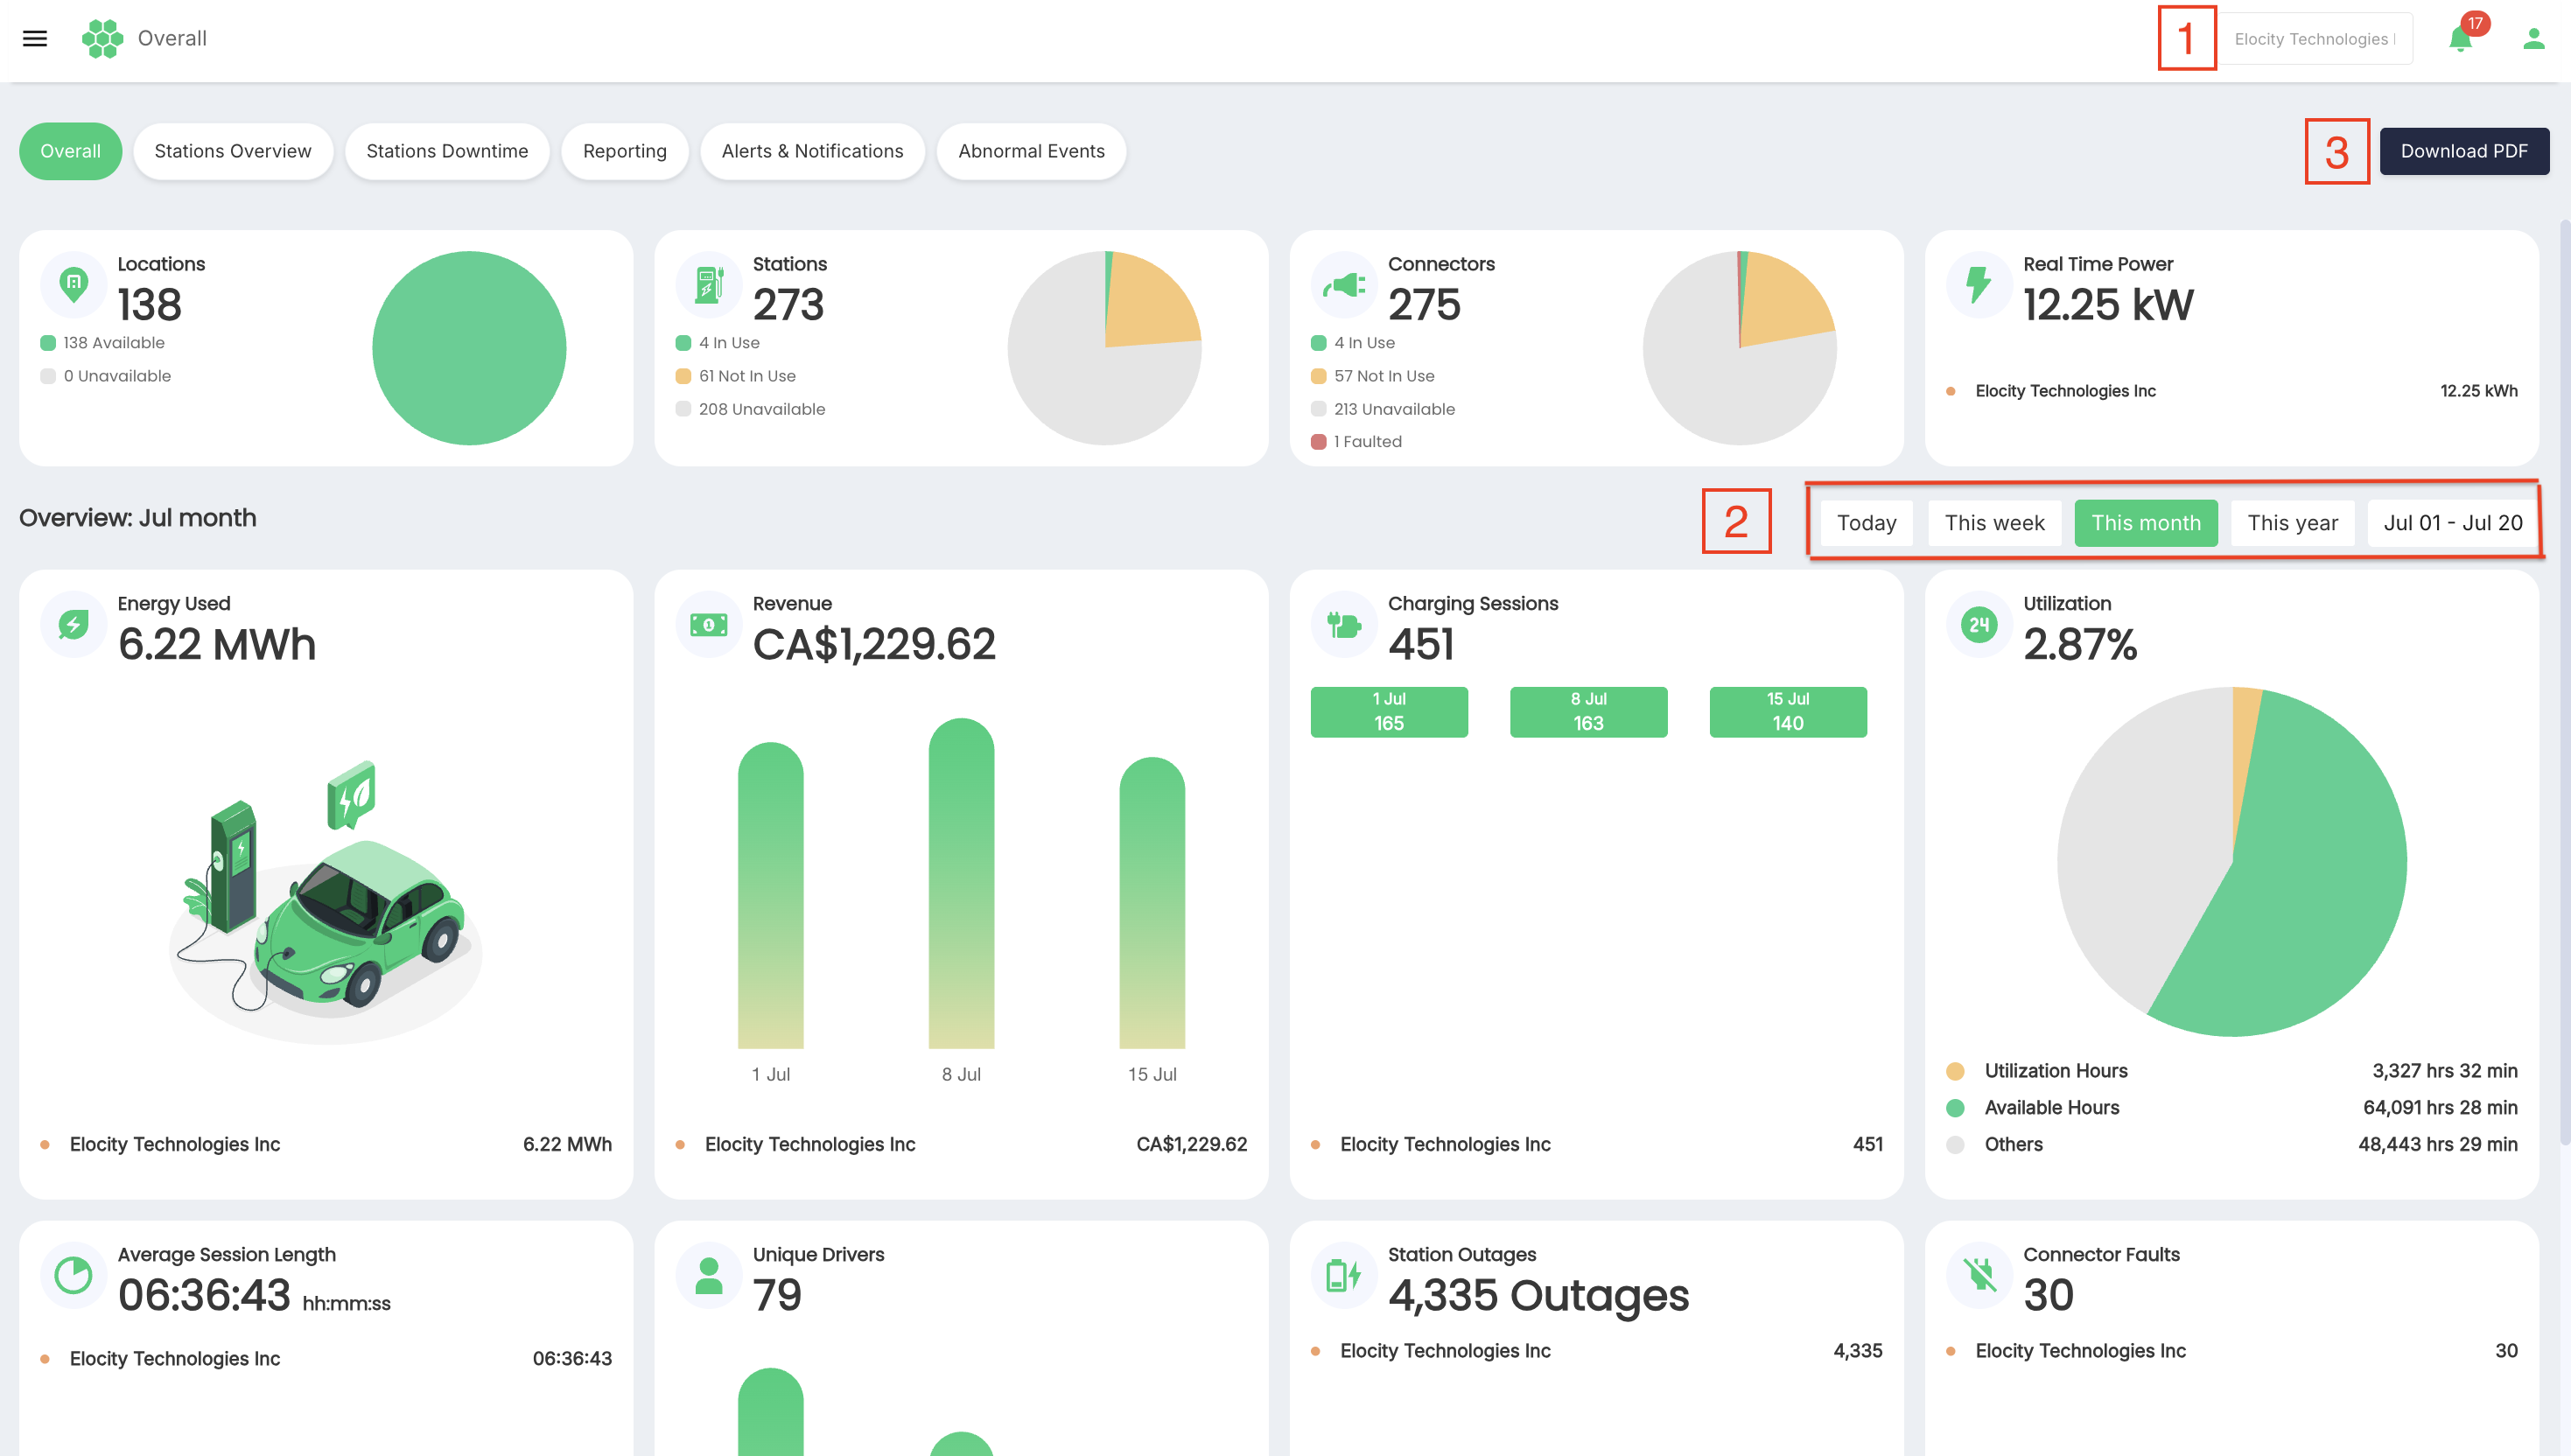
Business filter
The All Businesses selector defines the organizational scope of the dashboard. Select All Businesses to view consolidated information or choose an available business to focus the dashboard on that organization. The available options are determined by the user's assigned permissions.
-
Reporting period
Use one of the predefined periods—Today, This week, This month, or This year—to update the time-based dashboard analytics. To review a specific period, select the displayed date range and choose the required start and end dates.
The active reporting period is shown above the analytical widgets.
-
Download PDF
Select Download PDF to generate a PDF snapshot of the dashboard for offline review, record keeping, or sharing in accordance with your organization's data-handling policy. Before downloading, confirm that the required business and reporting period are selected.
Dashboard metrics
Locations
Displays the total number of charging locations within the selected business scope, with a breakdown by availability:
- Available — Locations that are currently available for operation.
- Unavailable — Locations that are not currently available.
Use this widget to obtain a high-level view of site availability across the network.
Stations
Displays the total number of charging stations and groups them by current operating state:
- In Use — Stations with an active charging session.
- Not In Use — Stations that are available but are not currently charging a vehicle.
- Unavailable — Stations that are not currently available for use.
This summary helps users assess station availability and identify possible service interruptions.
Connectors
Displays the total number of charging connectors and their current status:
- In Use — Connectors actively delivering a charging session.
- Not In Use — Connectors that are not currently in use.
- Unavailable — Connectors that cannot currently be used.
- Faulted — Connectors that have reported a fault condition.
Review unavailable or faulted connectors promptly to support network reliability and driver satisfaction.
Real-Time Power
Shows the current power demand across the selected network in kilowatts (kW). The accompanying breakdown highlights businesses or locations contributing to the live load.
Use this widget to monitor current demand, detect unexpected load patterns, and support operational load-management decisions.
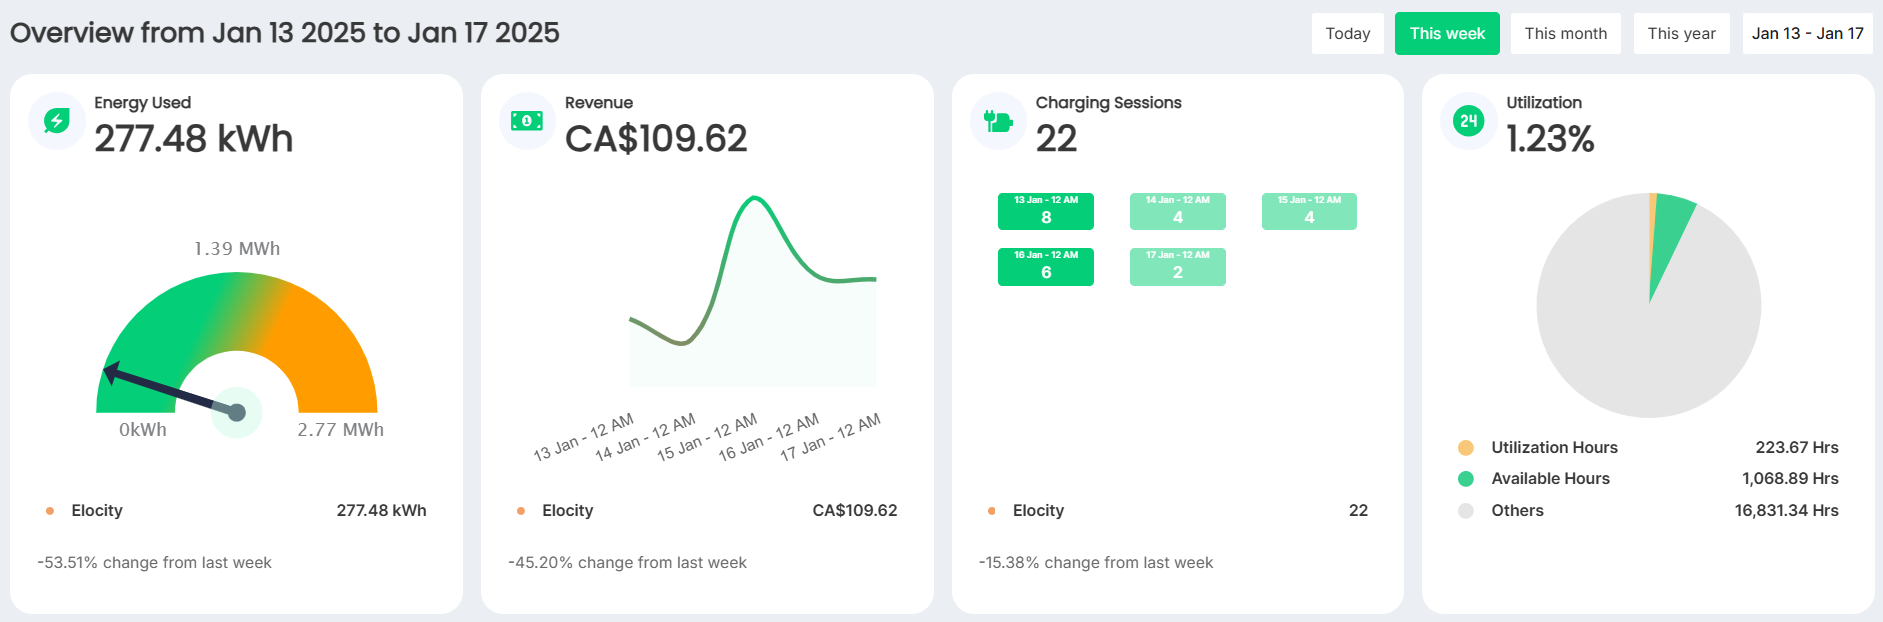
Energy Used
Shows the total electrical energy delivered during the selected reporting period in kilowatt-hours (kWh). The widget also identifies leading contributors to total consumption.
Use this information to review consumption trends, compare business or location performance, and support energy planning.
Revenue
Shows the charging revenue recorded during the selected reporting period in the configured currency. The contributor breakdown highlights businesses or locations generating the highest revenue.
Use this widget for a quick view of commercial performance. Refer to the appropriate financial report when reconciliation or transaction-level validation is required.
Charging Sessions
Shows the total number of charging sessions recorded during the selected reporting period. The chart illustrates session activity over time, while the contributor breakdown highlights businesses or locations with the most sessions.
Use this metric to identify demand patterns and periods of high or low charging activity.
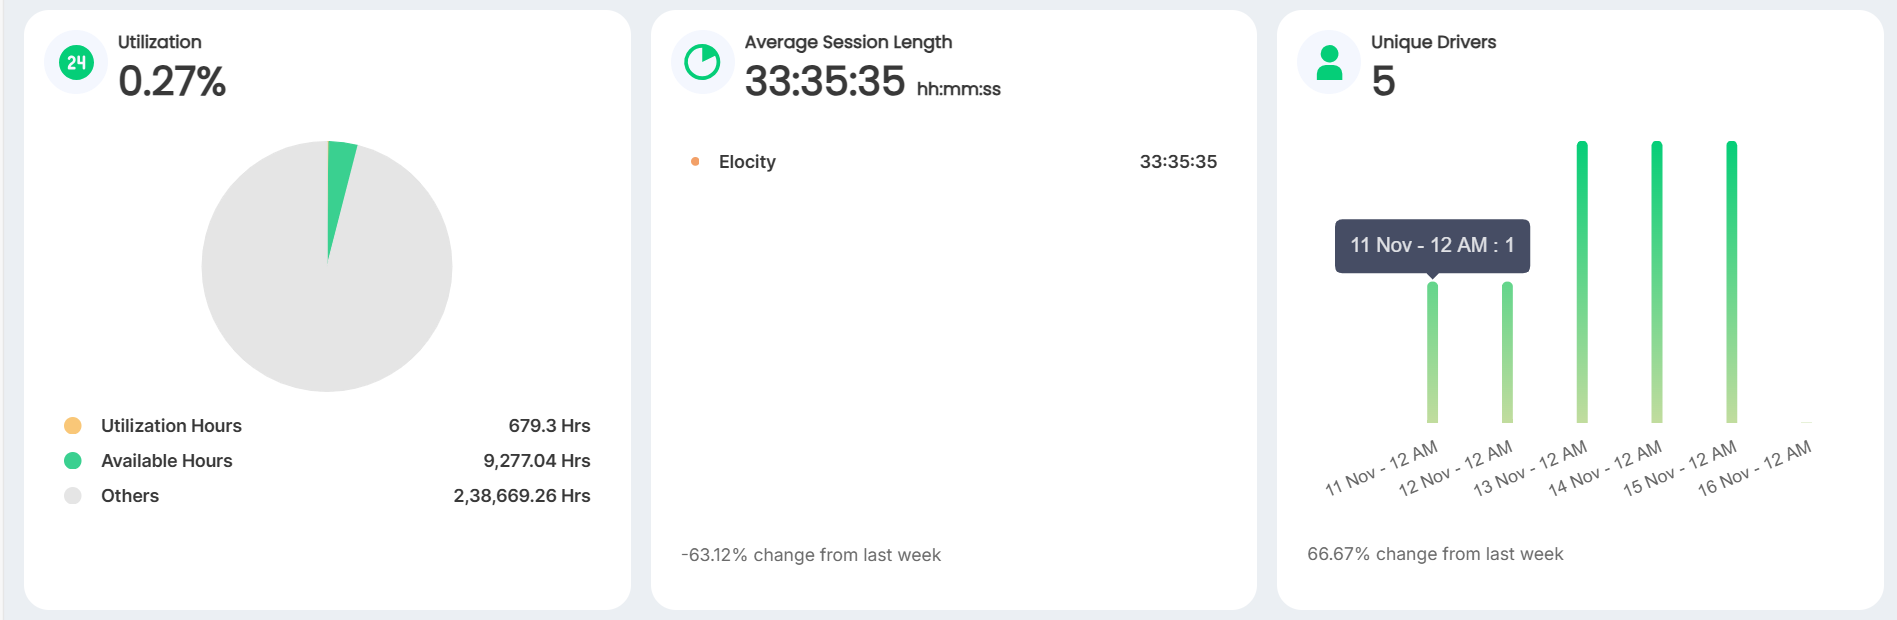
Utilization
Shows the proportion of recorded time during which charging assets were actively utilized. The widget includes a time-based breakdown such as:
- Utilization Hours — Time associated with active use.
- Available Hours — Time during which assets were available but not actively used.
- Others — Remaining recorded time assigned to other operational states.
Use utilization data to evaluate asset usage, identify underused capacity, and support expansion or optimization decisions.
Average Session Length
Shows the average duration of charging sessions in hh:mm:ss format for the selected scope and reporting period. The supporting breakdown compares average session duration across businesses or locations.
Use this metric to understand typical driver behaviour and identify unusually short or long charging patterns.
Unique Drivers
Shows the number of distinct drivers who completed or initiated charging activity during the selected reporting period.
Use this metric to assess customer reach and distinguish growth in the driver base from repeated activity by existing drivers.
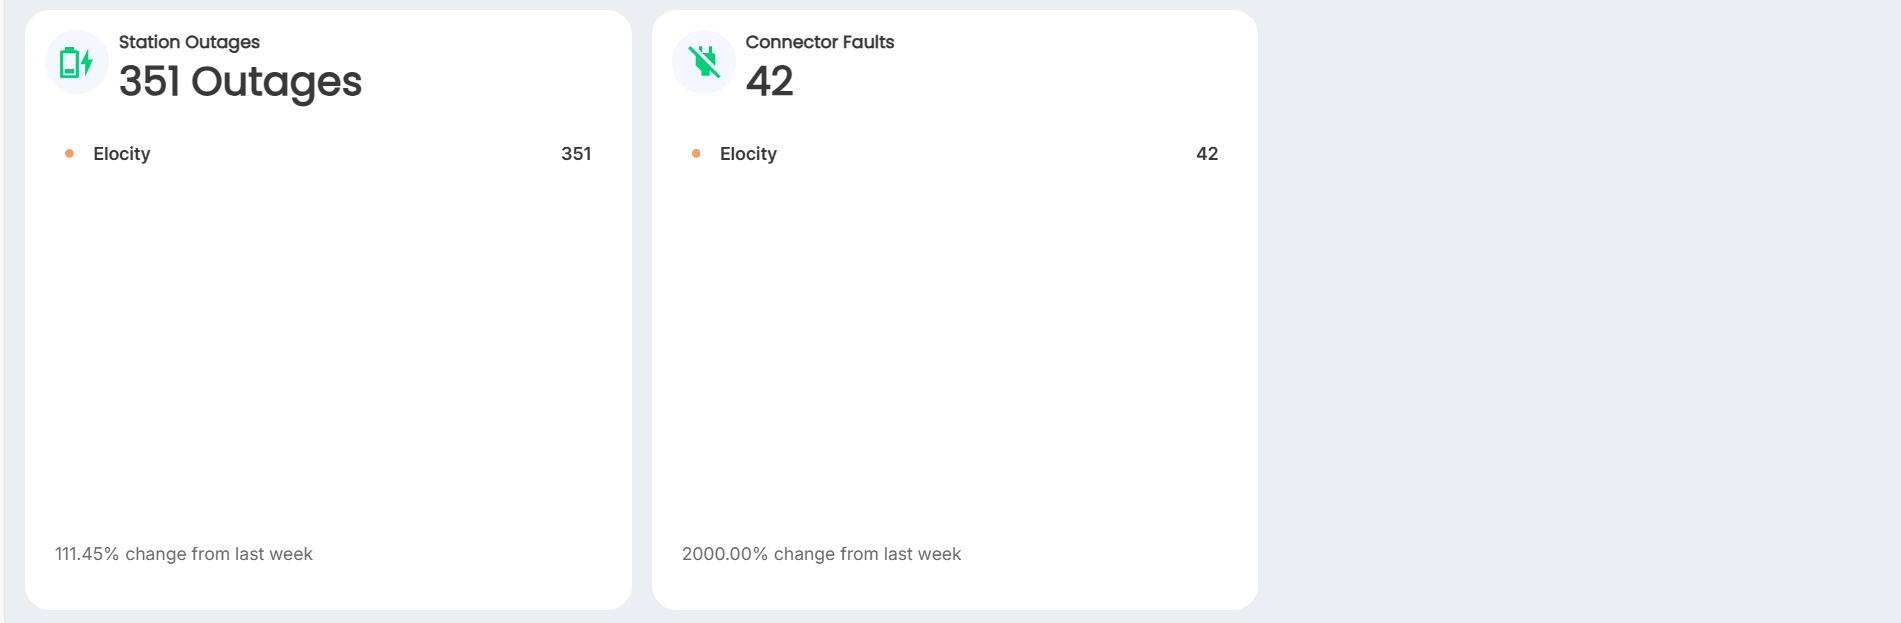
Station Outages
Shows the total number of recorded station-outage events and identifies the businesses or locations with the highest outage counts.
Use this widget to prioritize investigation and maintenance. For detailed outage analysis, open the Stations Downtime dashboard.
Connector Faults
Shows the total number of connectors currently reporting fault conditions, together with a breakdown by business or location.
Use this widget to identify where corrective action is required. Validate the affected connector's current status before dispatching maintenance, because operational conditions may change as new data is received.
Recommended workflow
- Select the required business scope.
- Choose a predefined reporting period or set a custom date range.
- Review Locations, Stations, and Connectors for availability issues.
- Check Real-Time Power, Energy Used, Revenue, Charging Sessions, and Utilization for performance trends.
- Review Station Outages and Connector Faults for issues requiring follow-up.
- Open the relevant dashboard subpage when more detailed analysis is required.
- Select Download PDF if a point-in-time record of the dashboard is needed.
Interpretation notes
- Values can change as live station and session data is received.
- A zero value indicates that no matching records are currently displayed for the selected scope and period; it does not necessarily confirm that an asset has never experienced the condition.
- Totals may differ between users when their business assignments or access permissions are different.
- If a value appears unexpected, verify the selected business and reporting period before beginning further investigation.