Alerts & Notifications
Purpose
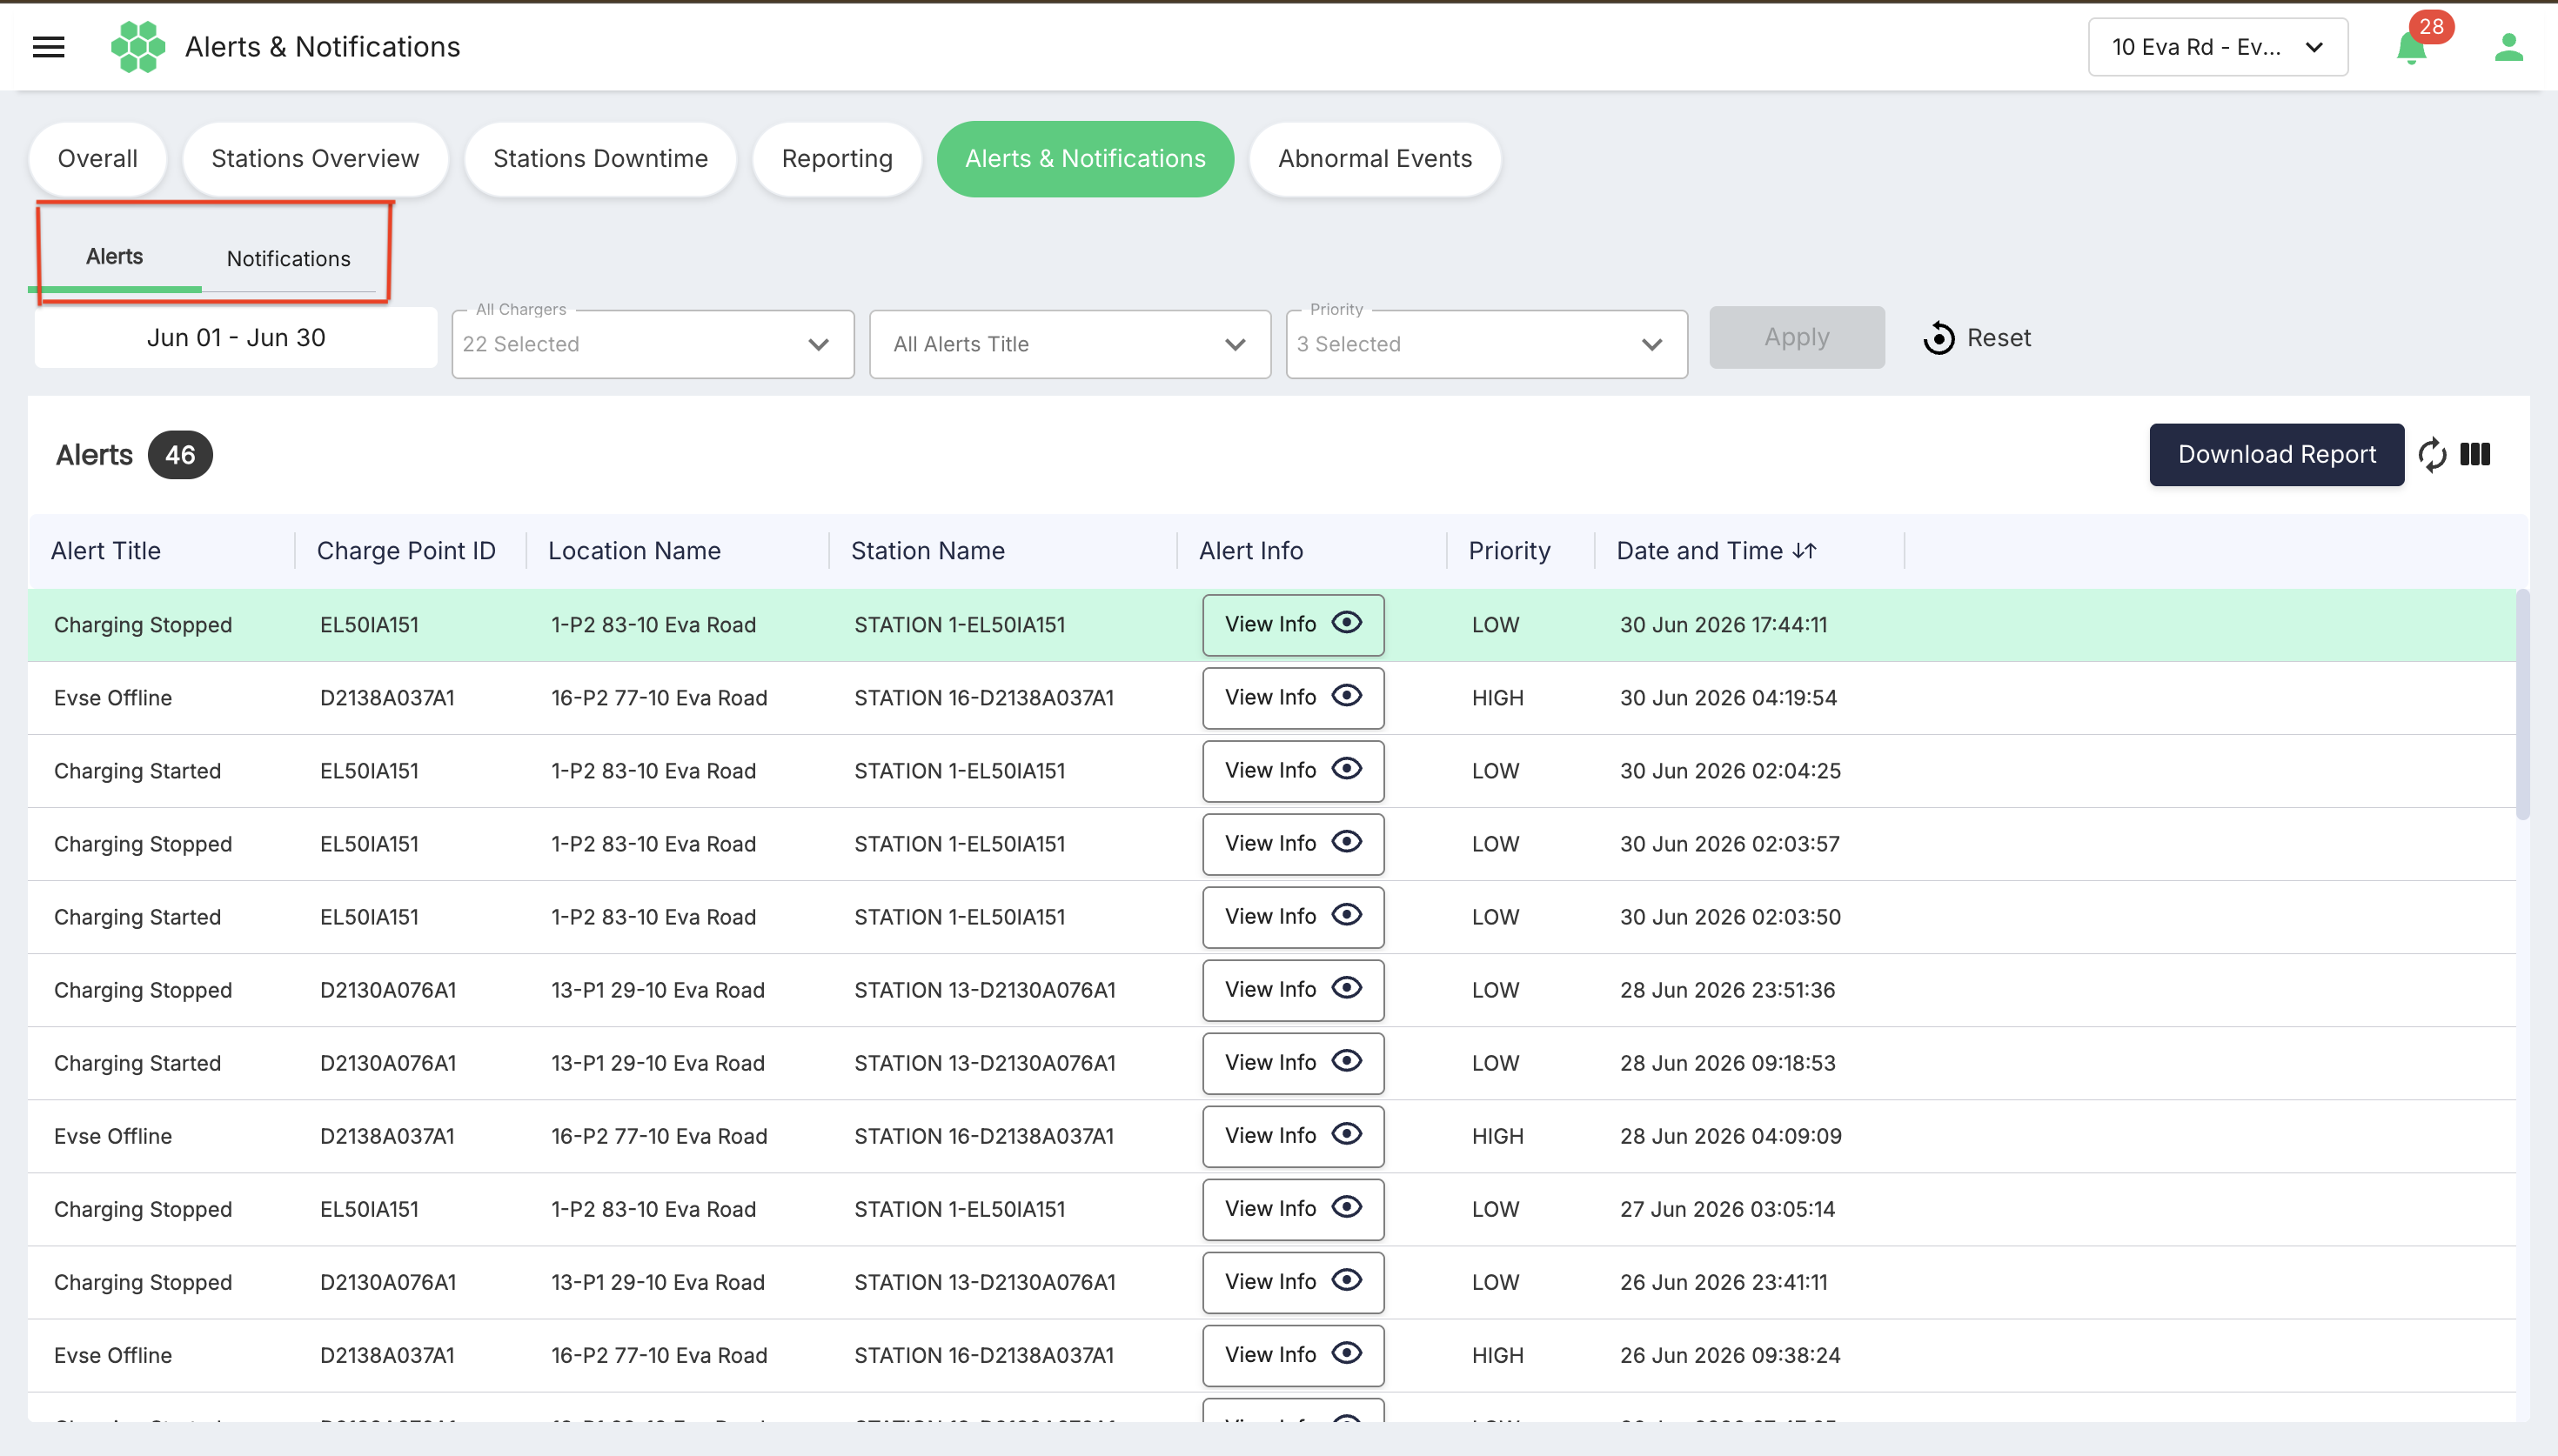
The Alerts & Notifications page provides a time-based record of operational events and informational updates generated for the EV charging network. Use it to identify events affecting chargers and charging activity, review event details, filter records by business and operational criteria, refresh the latest data, configure the grid, and download records for further review.
The page is divided into two tabs:
- Alerts — Displays events that occur on the charging network, including a charger going offline, a connector condition, the start or stop of a charging session, and a payment event. The current live page includes alert titles such as Evse Offline, Connector Faulted, Connector Unavailable, Charging Started, Charging Stopped, and Payment Successful.
- Notifications — Displays events triggered by operator actions and related operational updates, such as adding a location or charging station, changing a tariff assignment, or generating a usage update. The current live page includes notification titles such as Downtime Status, Hours of Use, Evse Added, Under Utilized, Tariff Updated, and Tariff Location Mapping Updated.
Each record includes a priority based on its expected operational impact:
- HIGH — Events that affect the EV driver experience or revenue.
- MEDIUM — Events with a lower operational impact.
- LOW — Data- or usage-related events.
Use the priority together with the record title and description when deciding what follow-up is required.
The available titles and records depend on the selected business, date range, system activity, and the user's access permissions.
Accessing the page
- Sign in to the HIEV portal.
- Open Dashboard.
- Select Alerts & Notifications.
- Select either the Alerts or Notifications tab.
Selecting the business scope
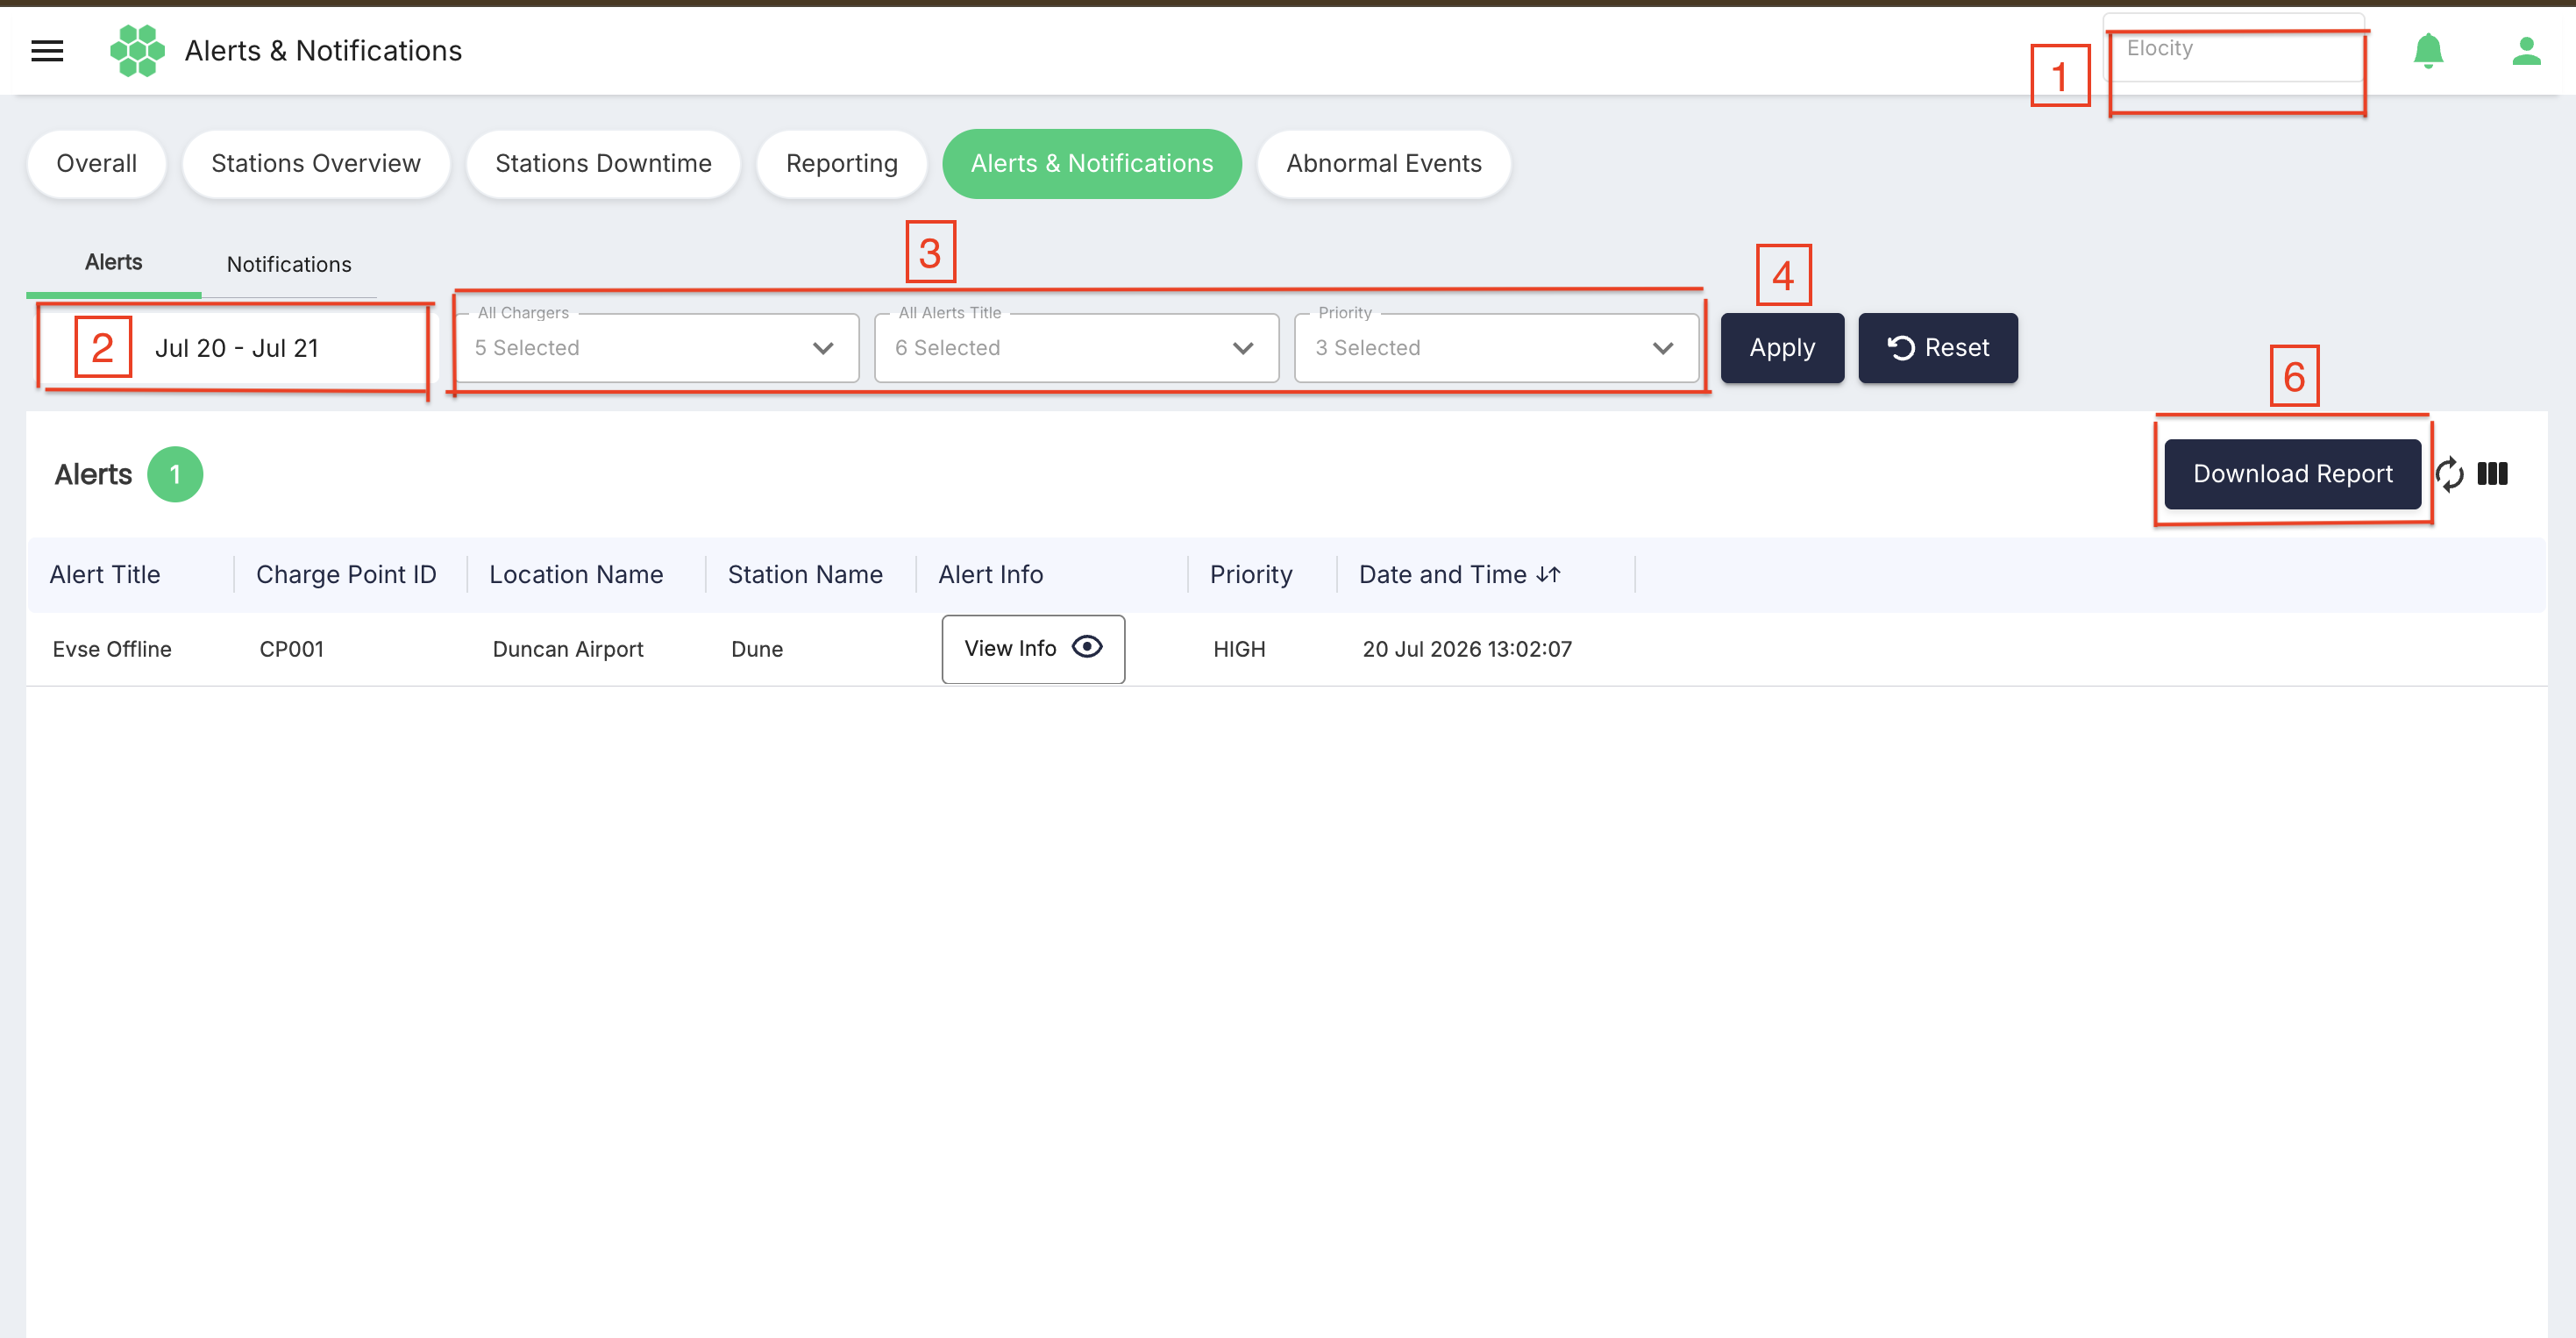
Use the business selector in the page header to choose the business whose records you want to review. The selected business controls the chargers, locations, alert and notification records, and filter options available on the page.
If a business has no records matching the active date range and filters, the grid displays a no-records message. A counter value of 0 means that there are no unread records in the applicable page context.
Always confirm the business selection before investigating an event or downloading a report.
Date-range filter
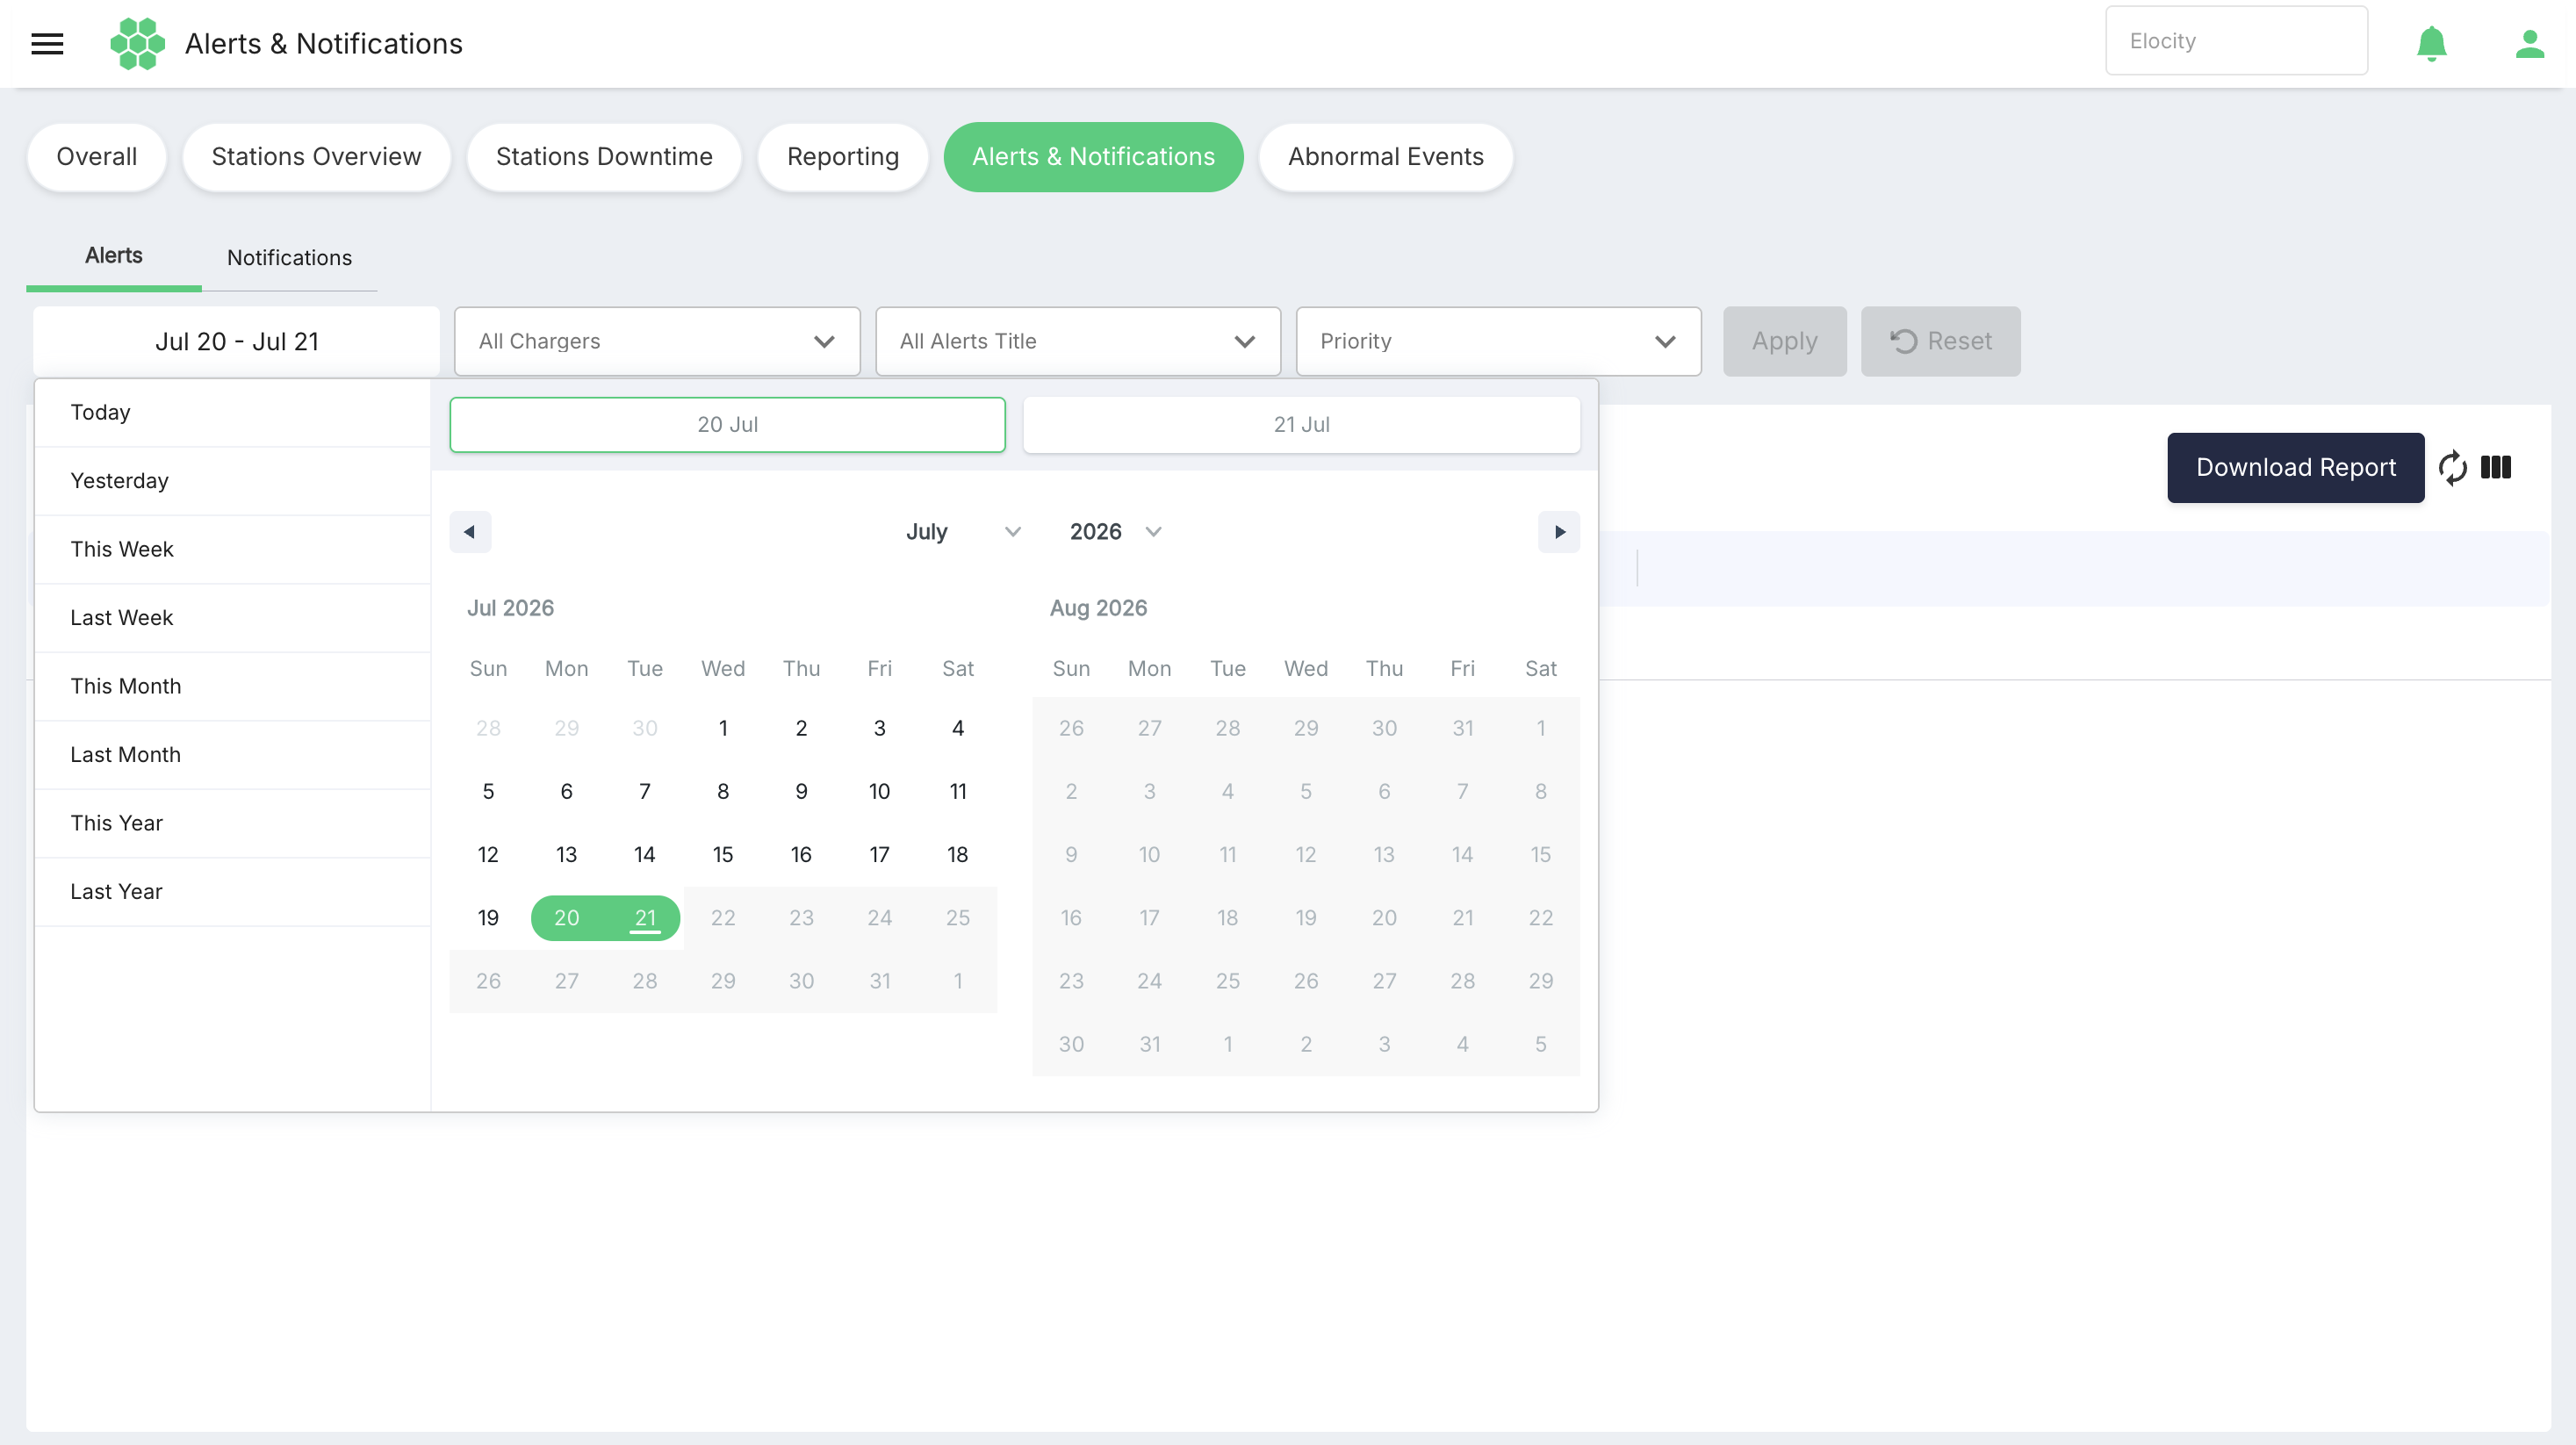
Select the displayed date range to open the calendar. The following predefined periods are available:
- Today
- Yesterday
- This Week
- Last Week
- This Month
- Last Month
- This Year
- Last Year
For a custom period, select the start and end dates in the two-month calendar. The month and year selectors can be used to move directly to another period.
After changing the date range or another page filter, select Apply to retrieve matching records. Select Reset to clear the page-level filter selections and return to the default filter state.
Dates and times displayed in the grids and record-detail dialogs use the browser's timezone. Technical logs use UTC. When correlating a portal record with a log entry, convert the timestamps to the same timezone before comparing them.
Alerts tab
The Alerts tab displays network-event records associated with individual charge points. The Alerts counter shows the number of unread alert records.
Alert filters
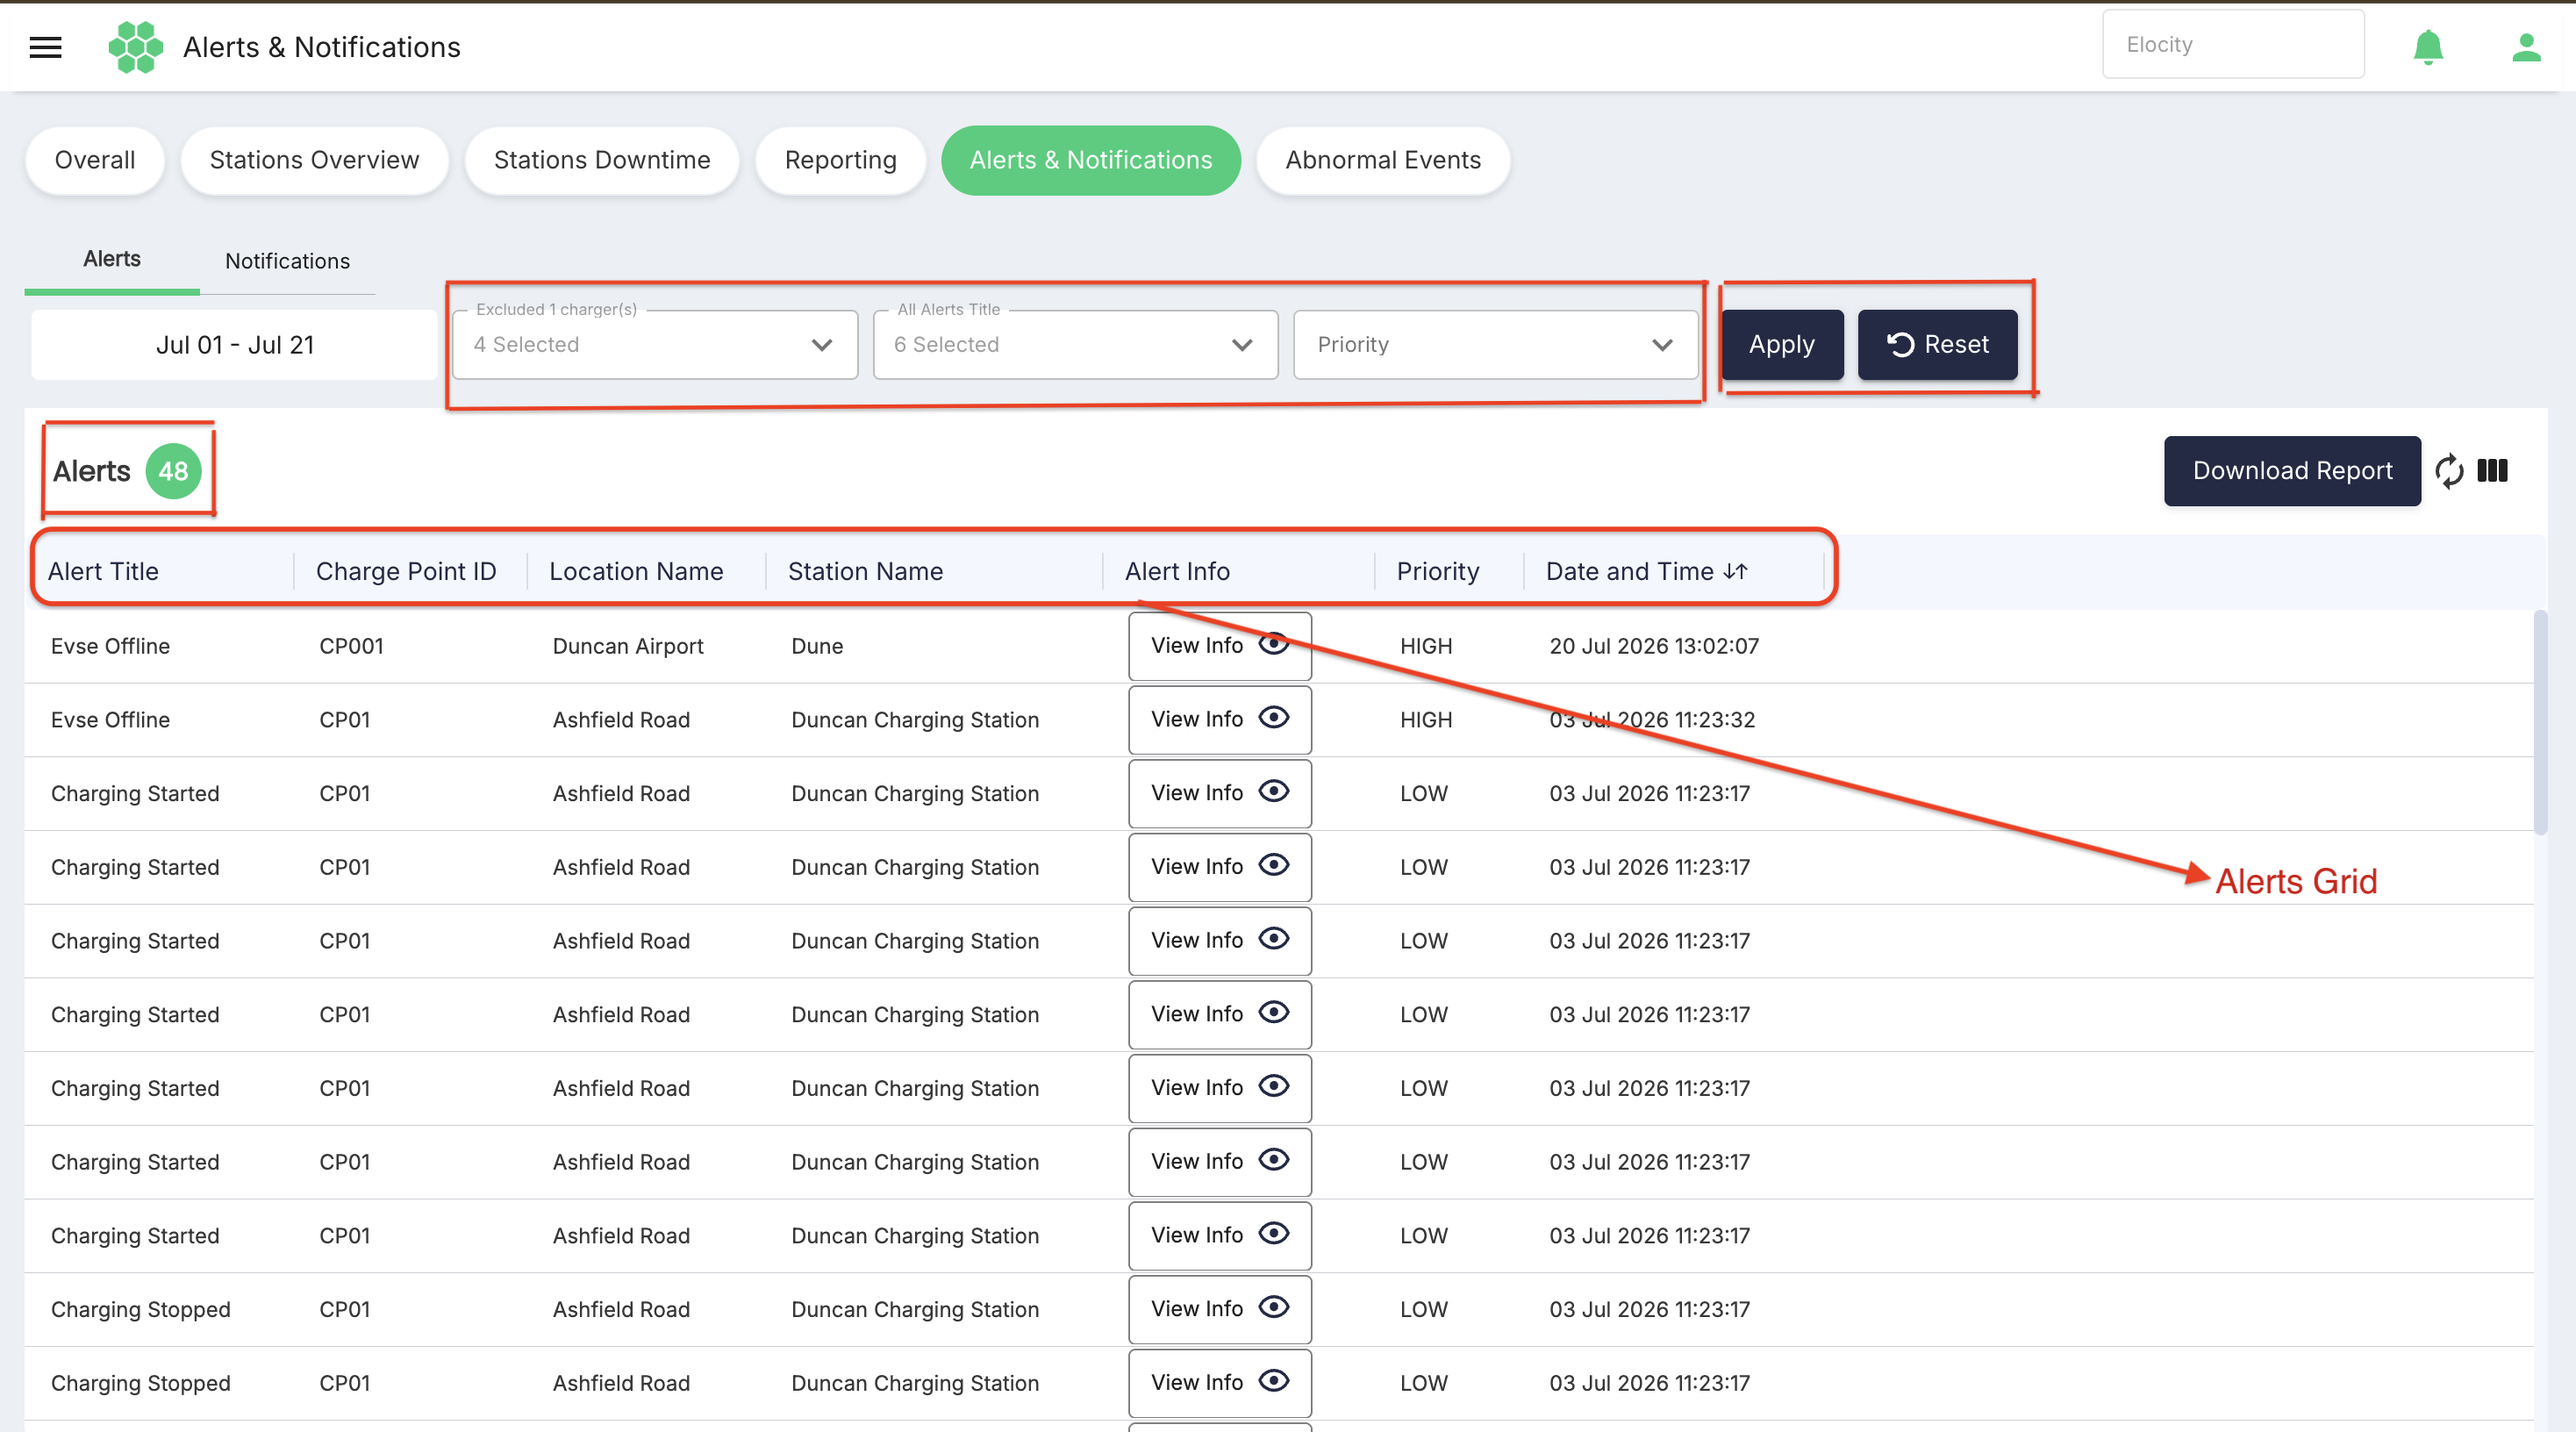
The following filters are available:
- All Chargers — Limits results to one or more chargers. Each option is displayed as the station name followed by its Charge Point ID in parentheses. Use the text field to locate a charger, select individual checkboxes, or use Select all.
- All Alerts Title — Limits results to selected alert types. The live list includes Evse Offline, Connector Faulted, Connector Unavailable, Charging Started, Charging Stopped, and Payment Successful. Select one or more titles or use Select all.
- Priority — Limits results to HIGH, MEDIUM, and/or LOW priority records. Multiple priorities can be selected.
Select Apply after making a selection. Use Reset to clear the active alert filters.
Alerts grid
Each row represents one alert record.
| Column | Description |
|---|---|
| Alert Title | Identifies the type of event, such as an offline charger, connector condition, charging event, or successful payment. |
| Charge Point ID | Shows the unique charger identifier associated with the event. Use it when correlating the record with station data or technical logs. |
| Location Name | Identifies the charging location where the event occurred. |
| Station Name | Shows the display name of the station associated with the alert. |
| Alert Info | Provides a View Info button for opening the full alert record. |
| Priority | Shows the assigned HIGH, MEDIUM, or LOW priority. |
| Date and Time | Shows when the alert was recorded, using the browser's timezone. |
Viewing alert details
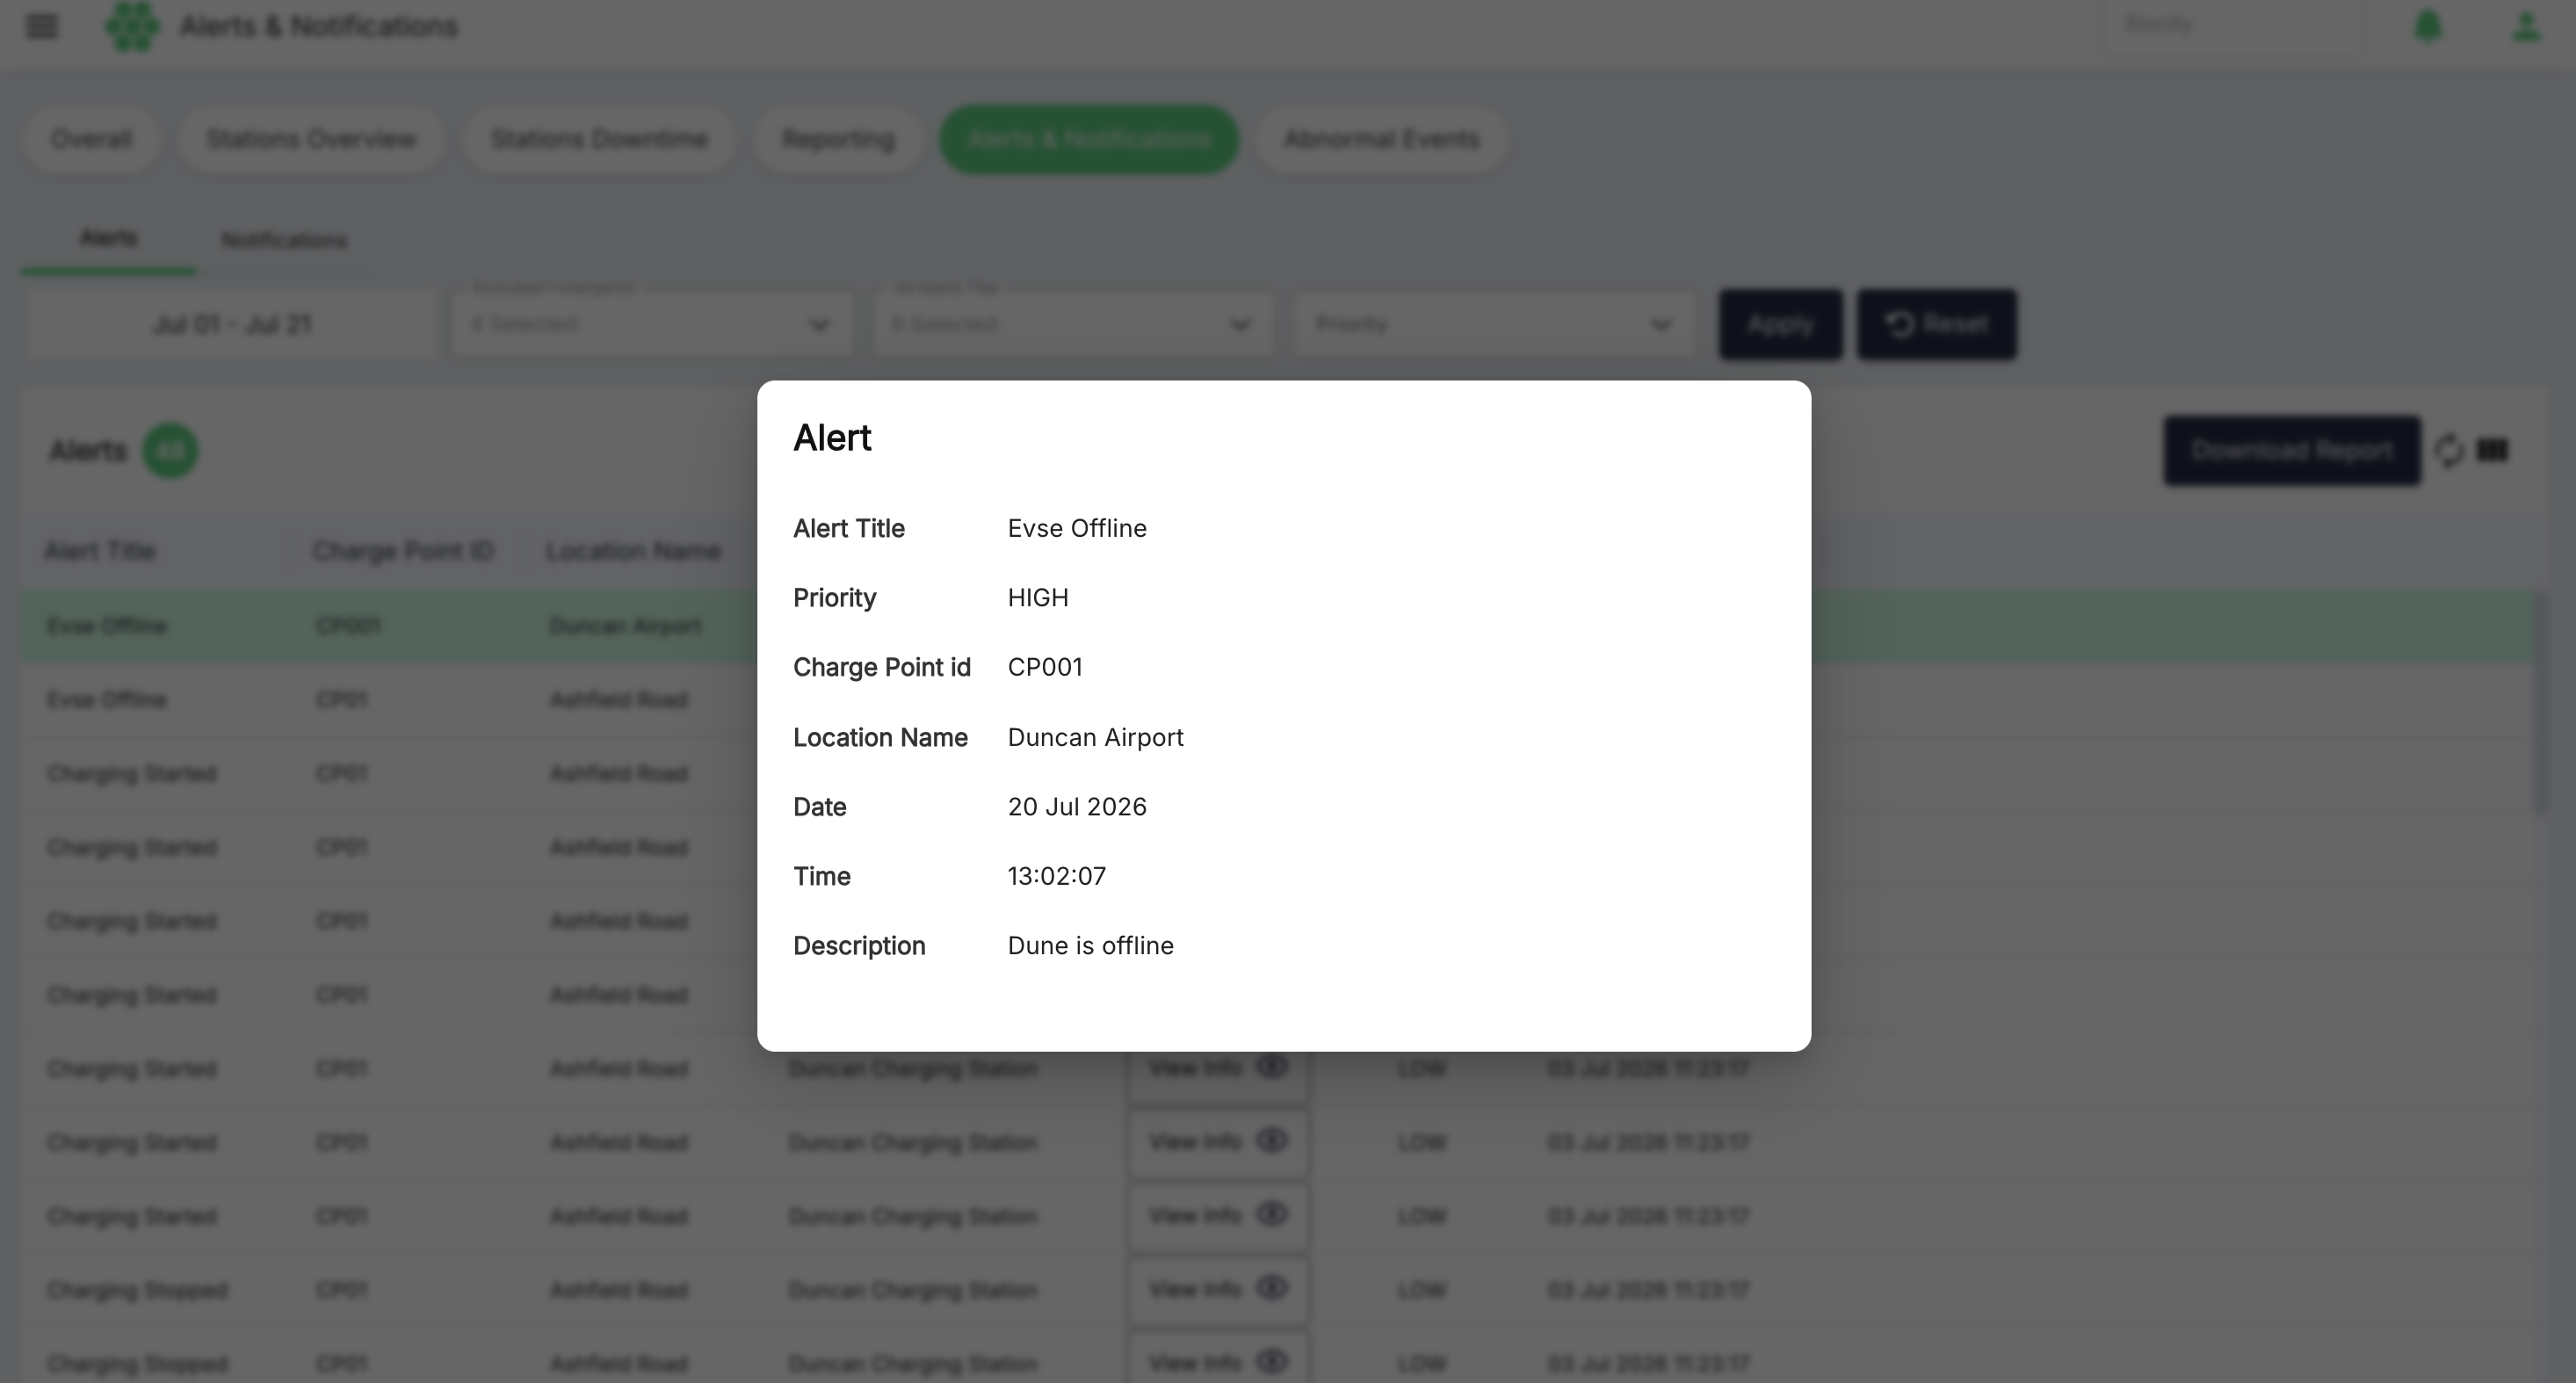
Select View Info in the required row to open the read-only Alert dialog. The dialog displays:
- Alert Title
- Priority
- Charge Point id
- Location Name
- Date
- Time
- Description
The description provides the event-specific message. For example, an Evse Offline alert can identify the station that is offline. Review this text before deciding what investigation or response is required.
Notifications tab
The Notifications tab displays operator-triggered, informational, and operational records associated with locations. The Notifications counter shows the number of unread notification records.
Notification filters
The following filters are available:
- All Locations — Limits results to one or more locations. Use the text field to locate a location, select individual checkboxes, or use Select all.
- All Notifications Title — Limits results to selected notification types. The live list includes Downtime Status, Hours of Use, Evse Added, Under Utilized, Tariff Updated, and Tariff Location Mapping Updated. Select one or more titles or use Select all.
- Priority — Limits results to HIGH, MEDIUM, and/or LOW priority records. Multiple priorities can be selected.
Select Apply after making a selection. Use Reset to clear the active notification filters.
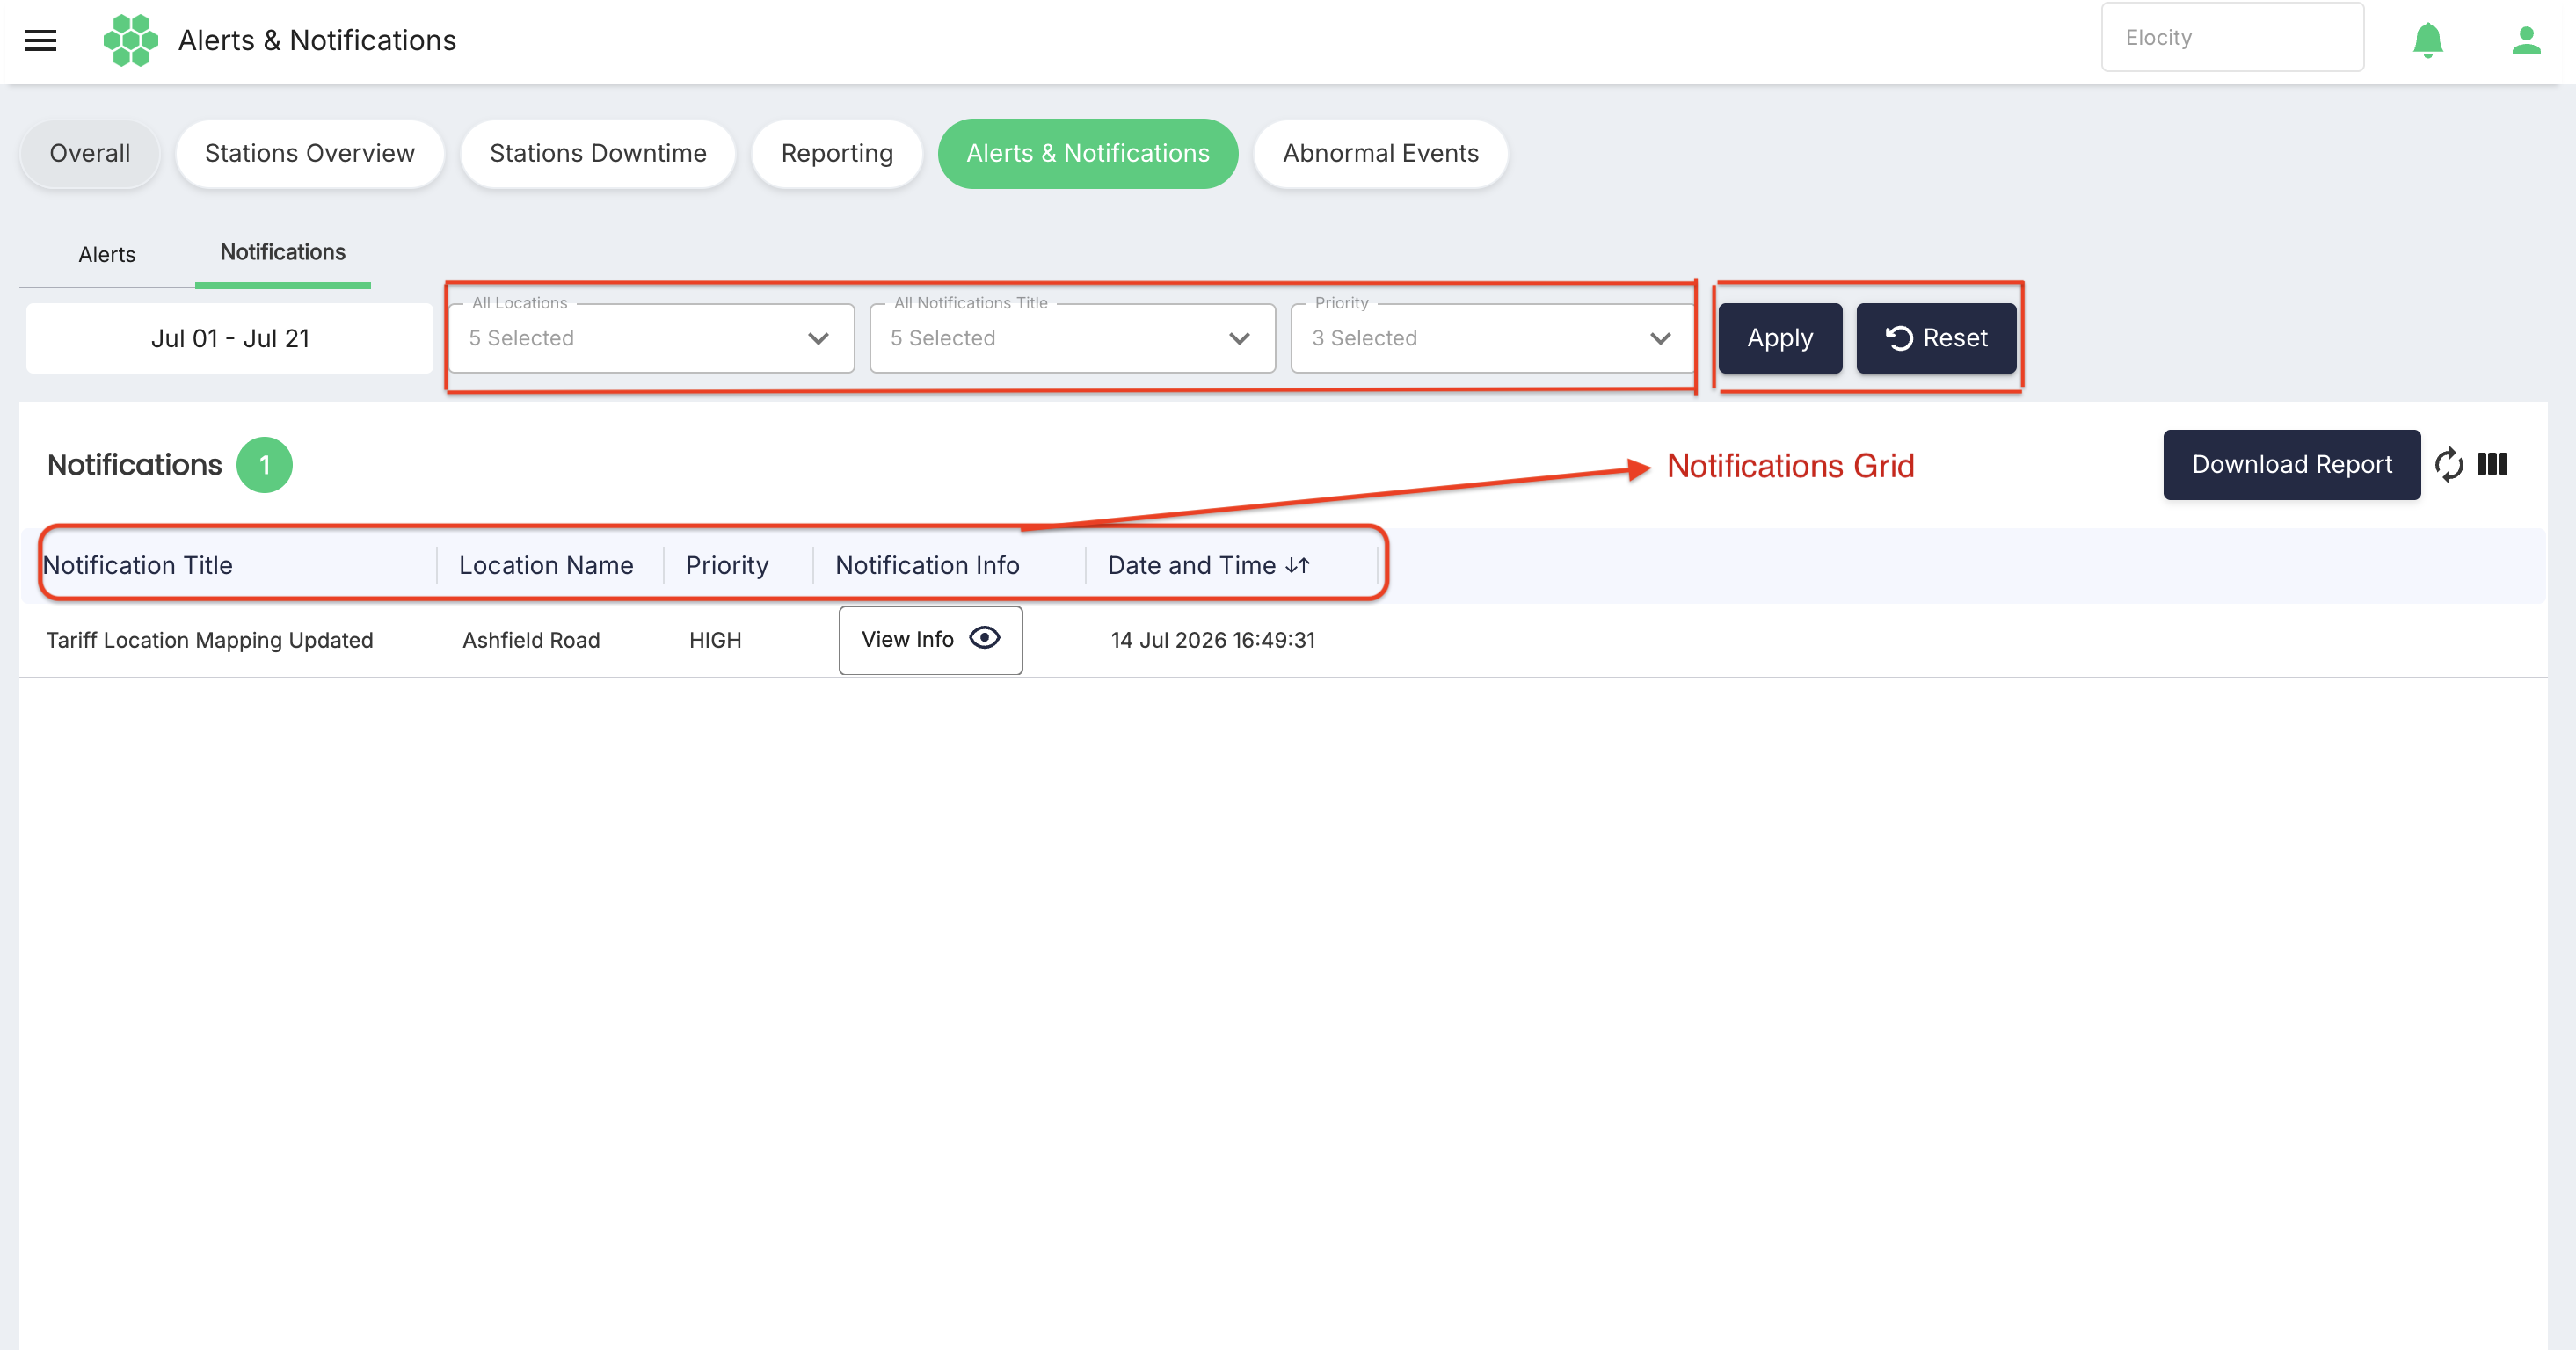
Notifications grid
Each row represents one notification record.
| Column | Description |
|---|---|
| Notification Title | Identifies the type of operational or informational update. |
| Location Name | Identifies the location associated with the notification. |
| Priority | Shows the assigned HIGH, MEDIUM, or LOW priority. |
| Notification Info | Provides a View Info button for opening the full notification record. |
| Date and Time | Shows when the notification was recorded, using the browser's timezone. |
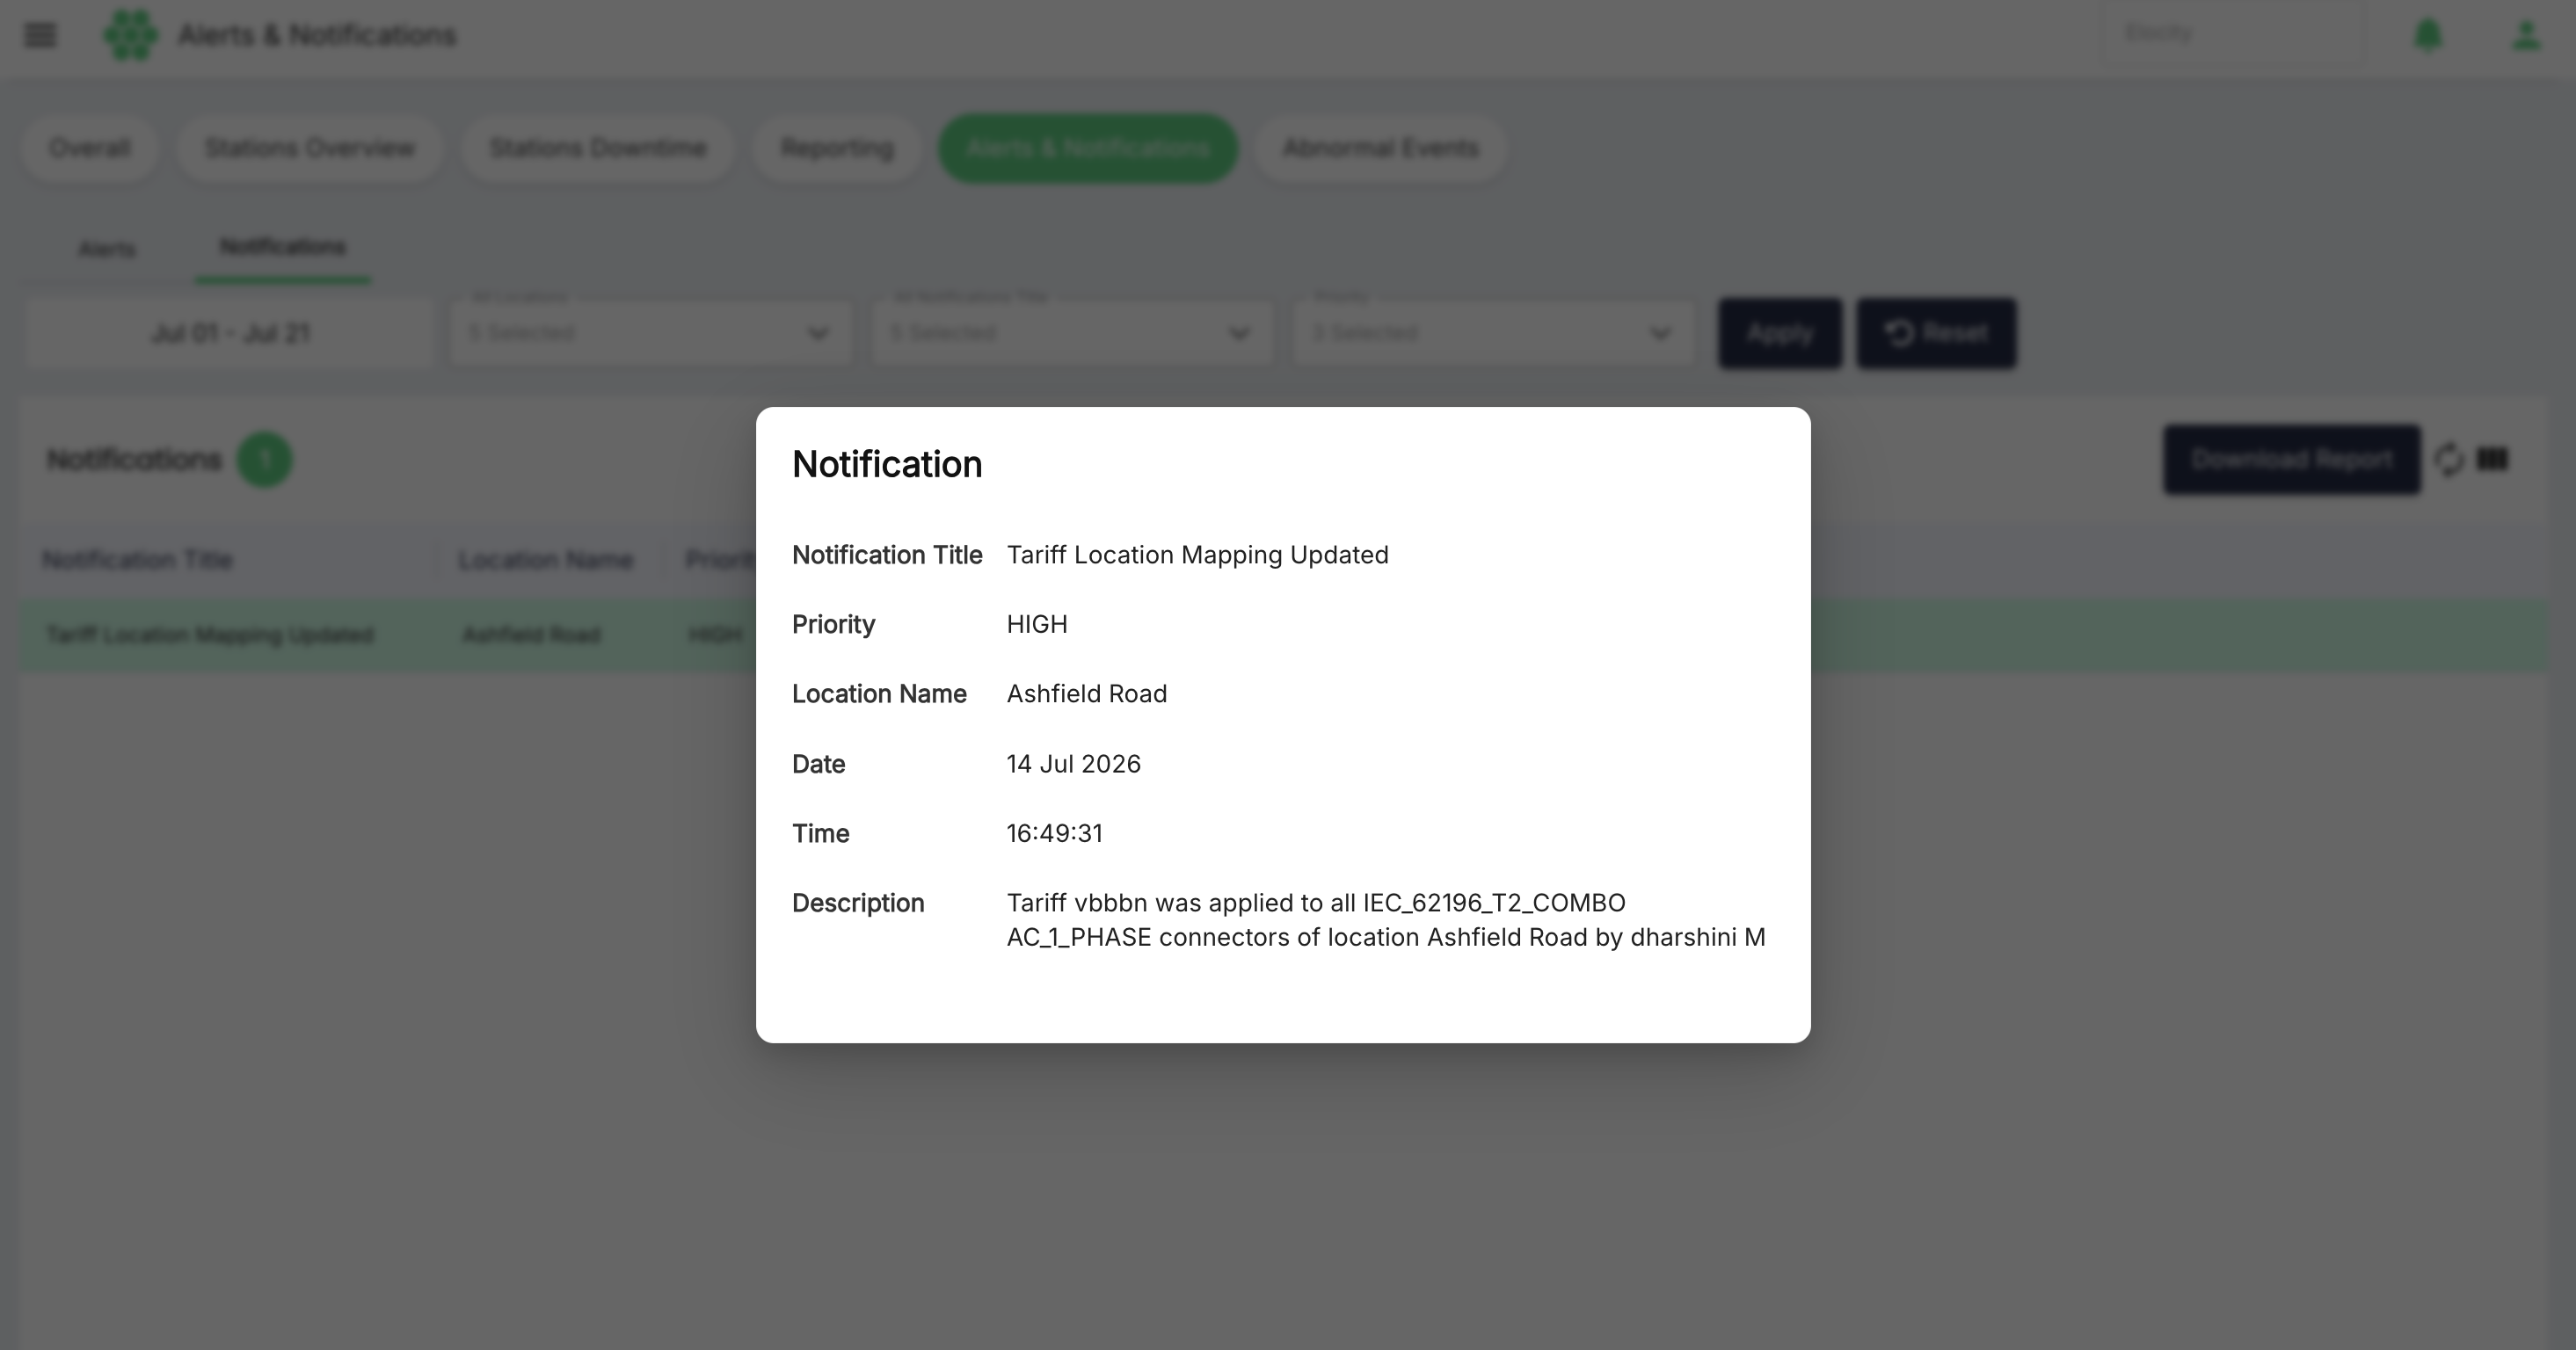
Viewing notification details
Select View Info in the required row to open the read-only Notification dialog. The dialog displays:
- Notification Title
- Priority
- Location Name
- Date
- Time
- Description
The description provides the notification-specific details. For example, an Hours of Use notification can state the number of usage hours recorded over the previous day.
Unread records and notification bell
Alert and notification counters represent unread records. Records are automatically marked as read when the user views them in the web application; no separate acknowledgement action is required on this page.
The number shown on the notification bell in the page header is the unread-record count. As records are read in the web application, the bell count decreases.
Grid controls
Both tabs provide the following controls when records are available:
Refresh
Select Refresh to request the latest available records. Refresh before confirming whether a recent event is present or before beginning an operational investigation.
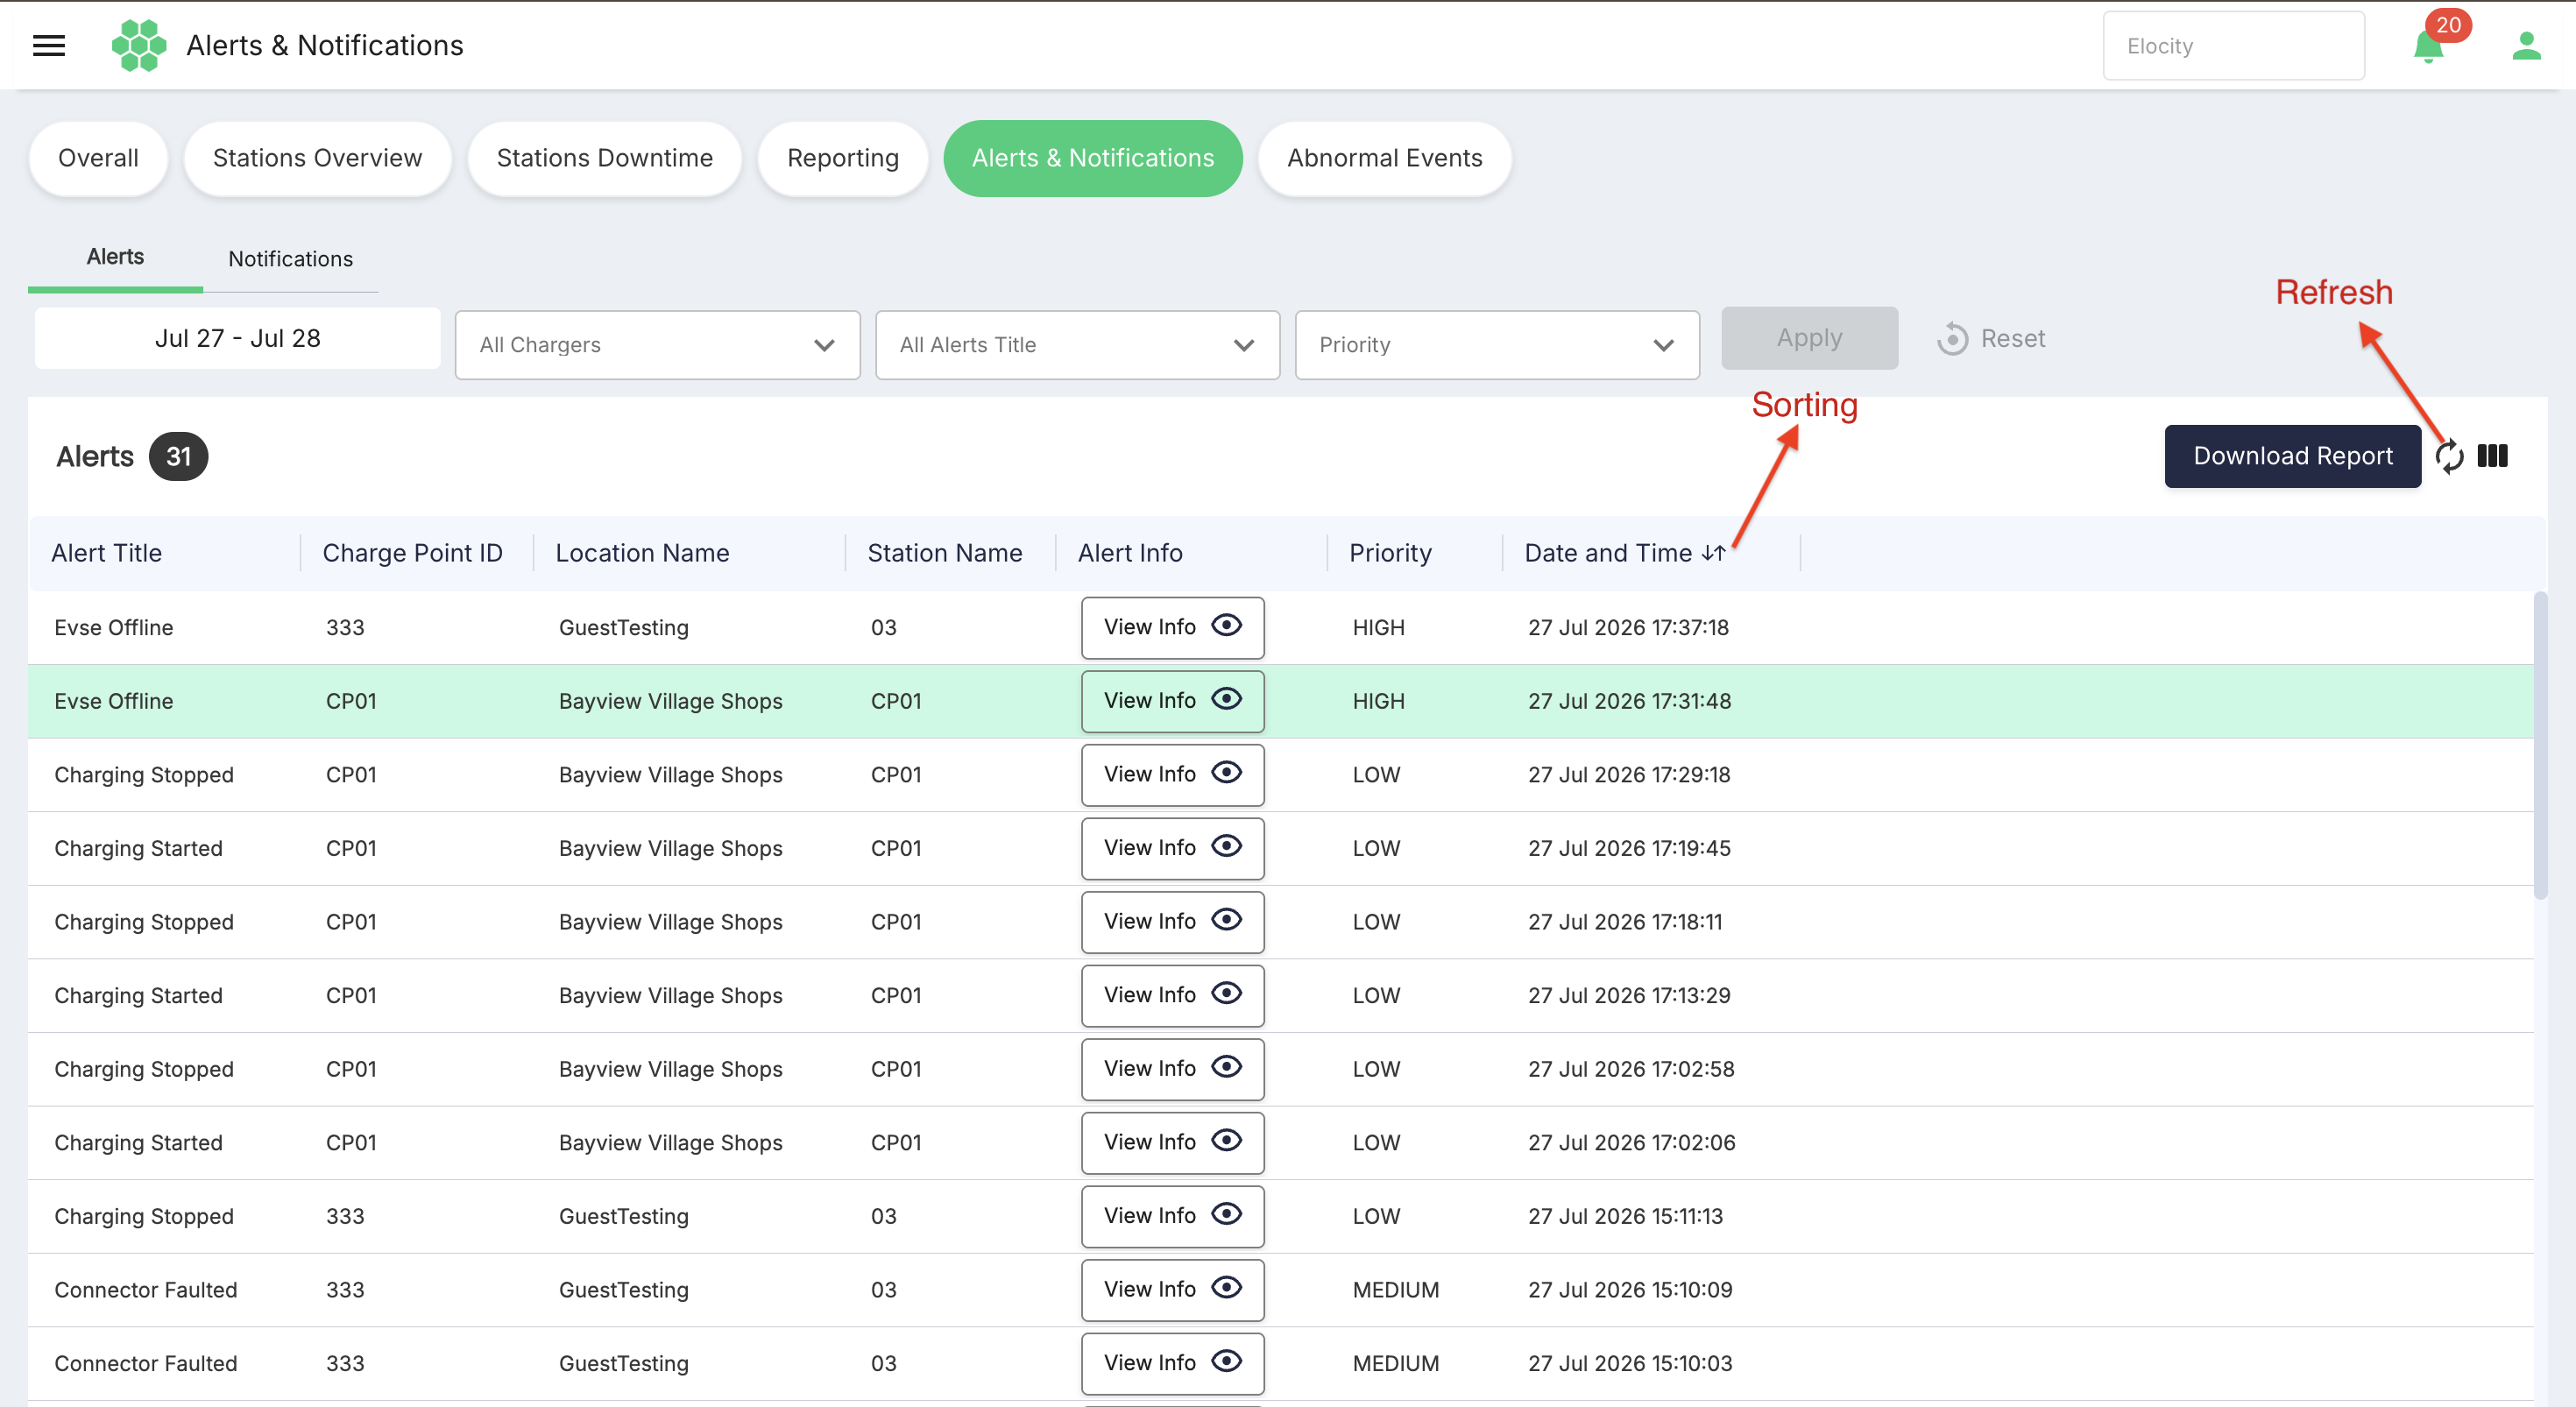
Sorting and column controls
The grid headers display controls for organizing or filtering supported columns. Use these controls to narrow the visible records or change their order without changing the business and page-level filter selections.
Both grids use infinite scrolling and load additional matching records as the user moves through the results. Only part of the result set may therefore be visible on screen at one time.
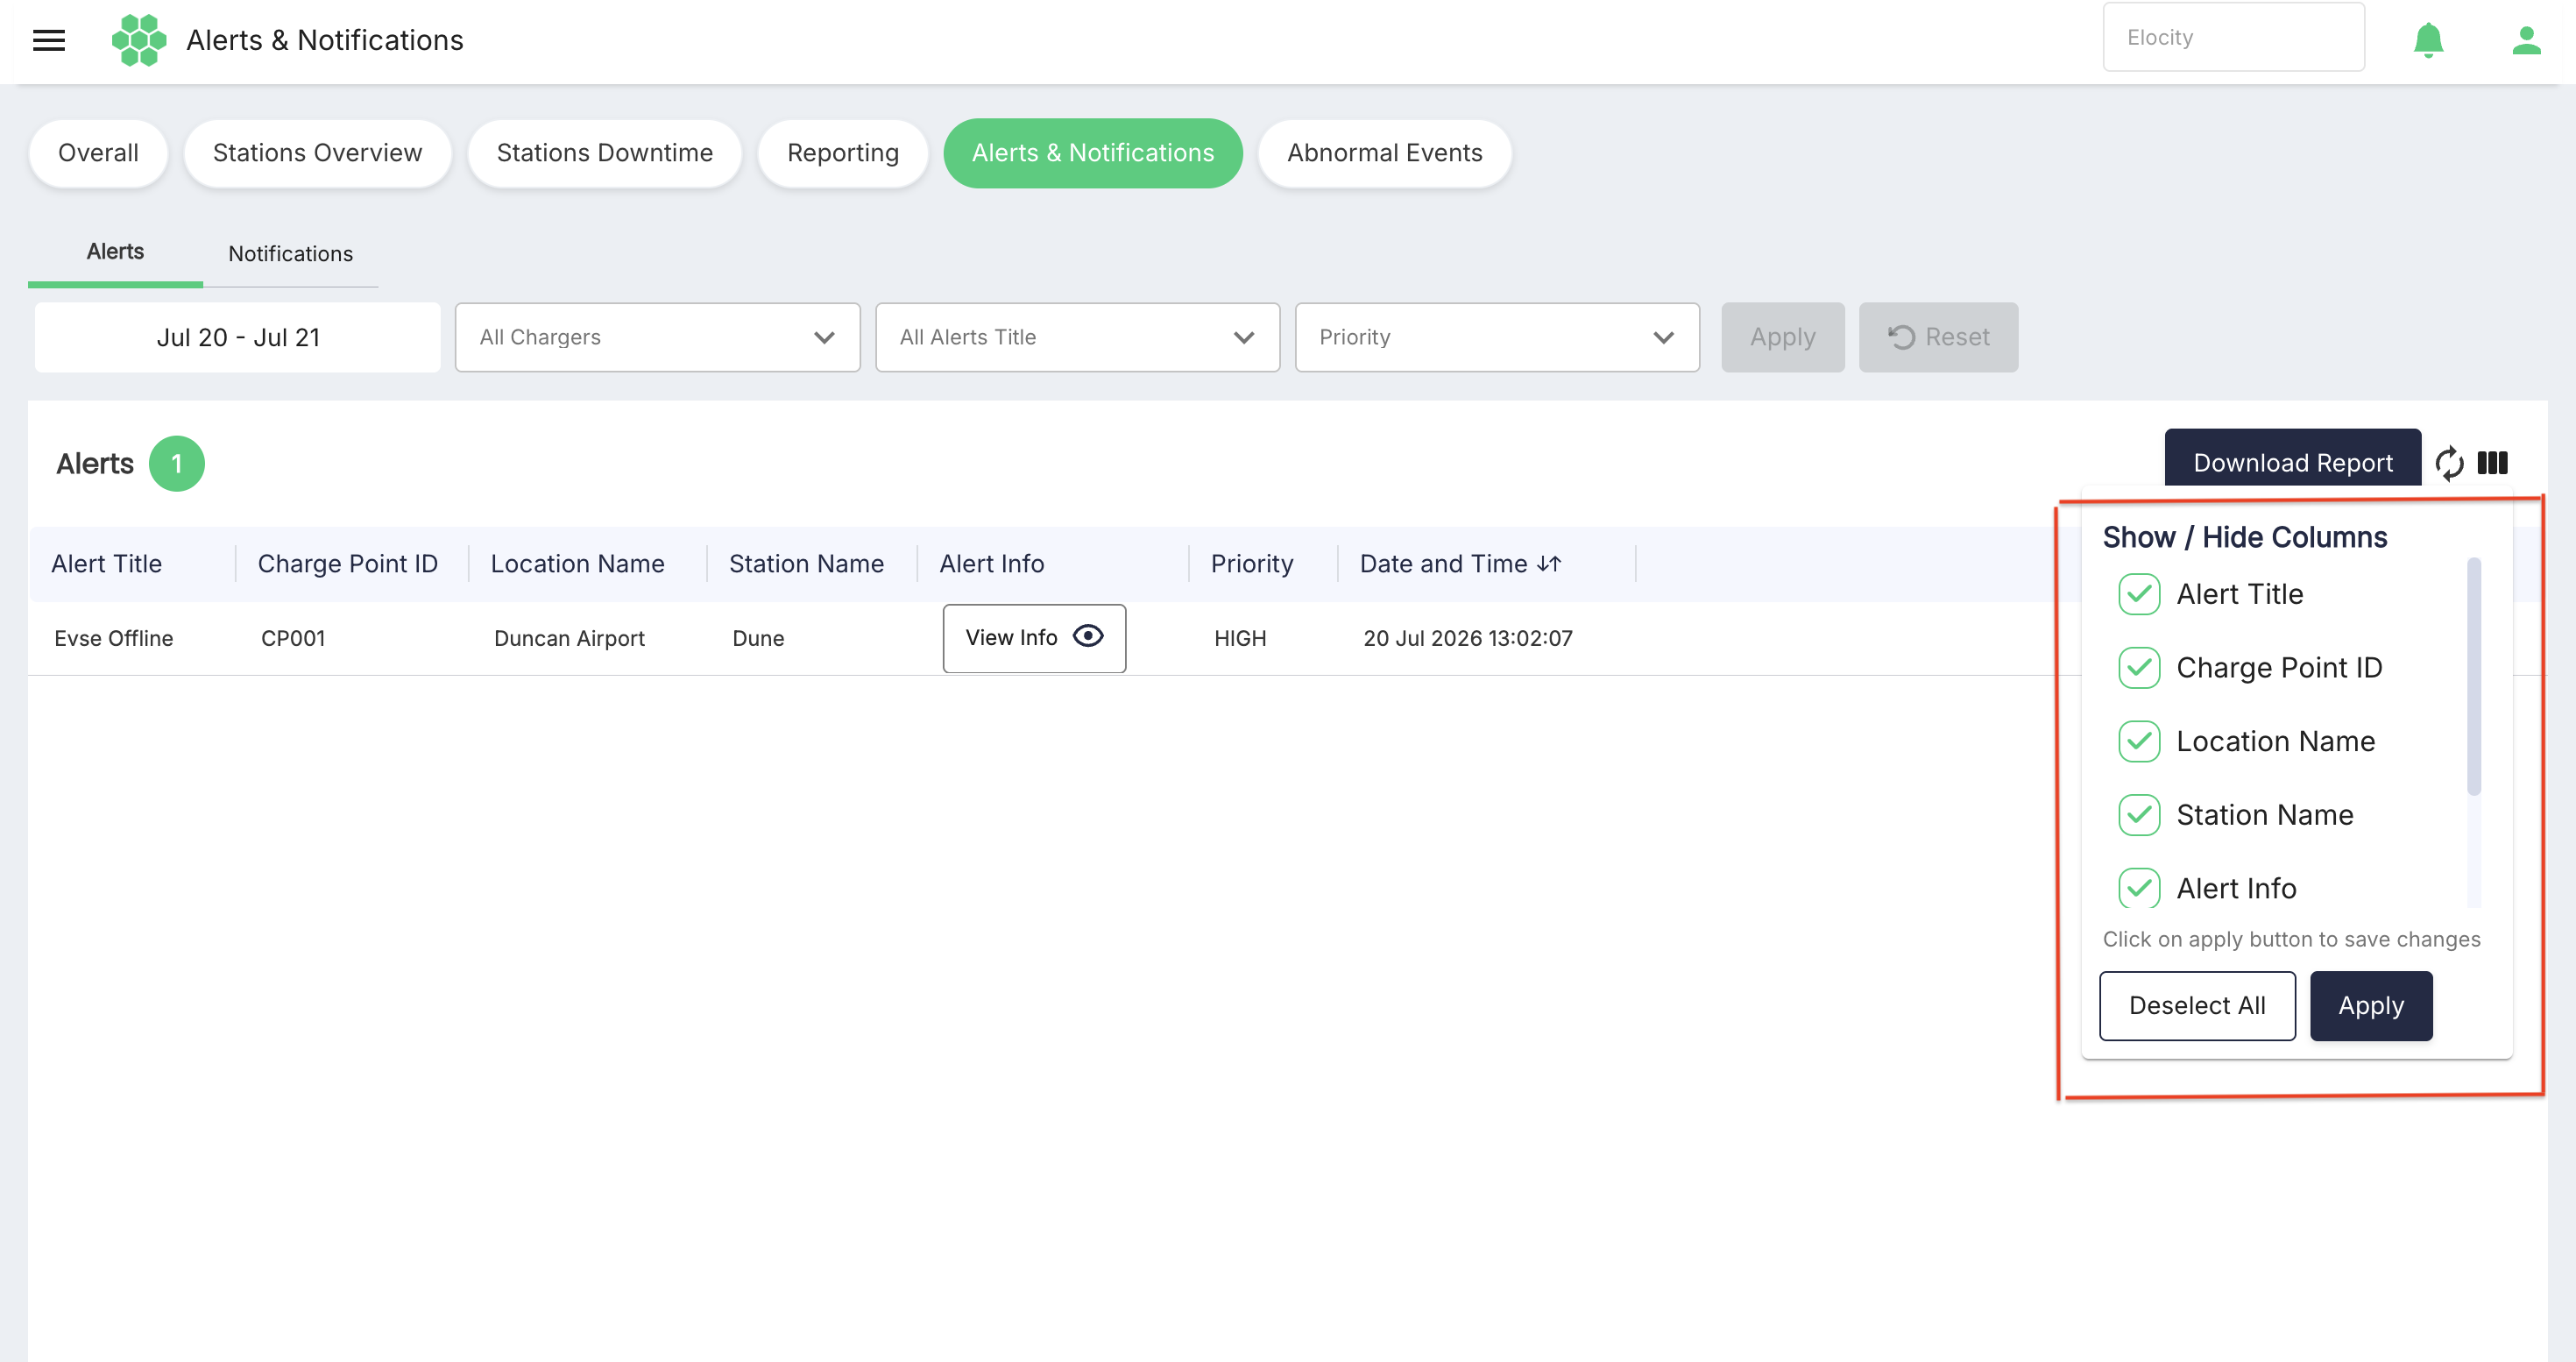
Showing and hiding columns
Select Column Filter to open the Show / Hide Columns menu.
For Alerts, the configurable columns are:
- Alert Title
- Charge Point ID
- Location Name
- Station Name
- Alert Info
- Priority
- Date and Time
For Notifications, the configurable columns are:
- Notification Title
- Location Name
- Priority
- Notification Info
- Date and Time
Select or clear the checkbox beside each column, then select Apply inside the column menu to save the grid layout. Select Deselect All to clear all column selections.
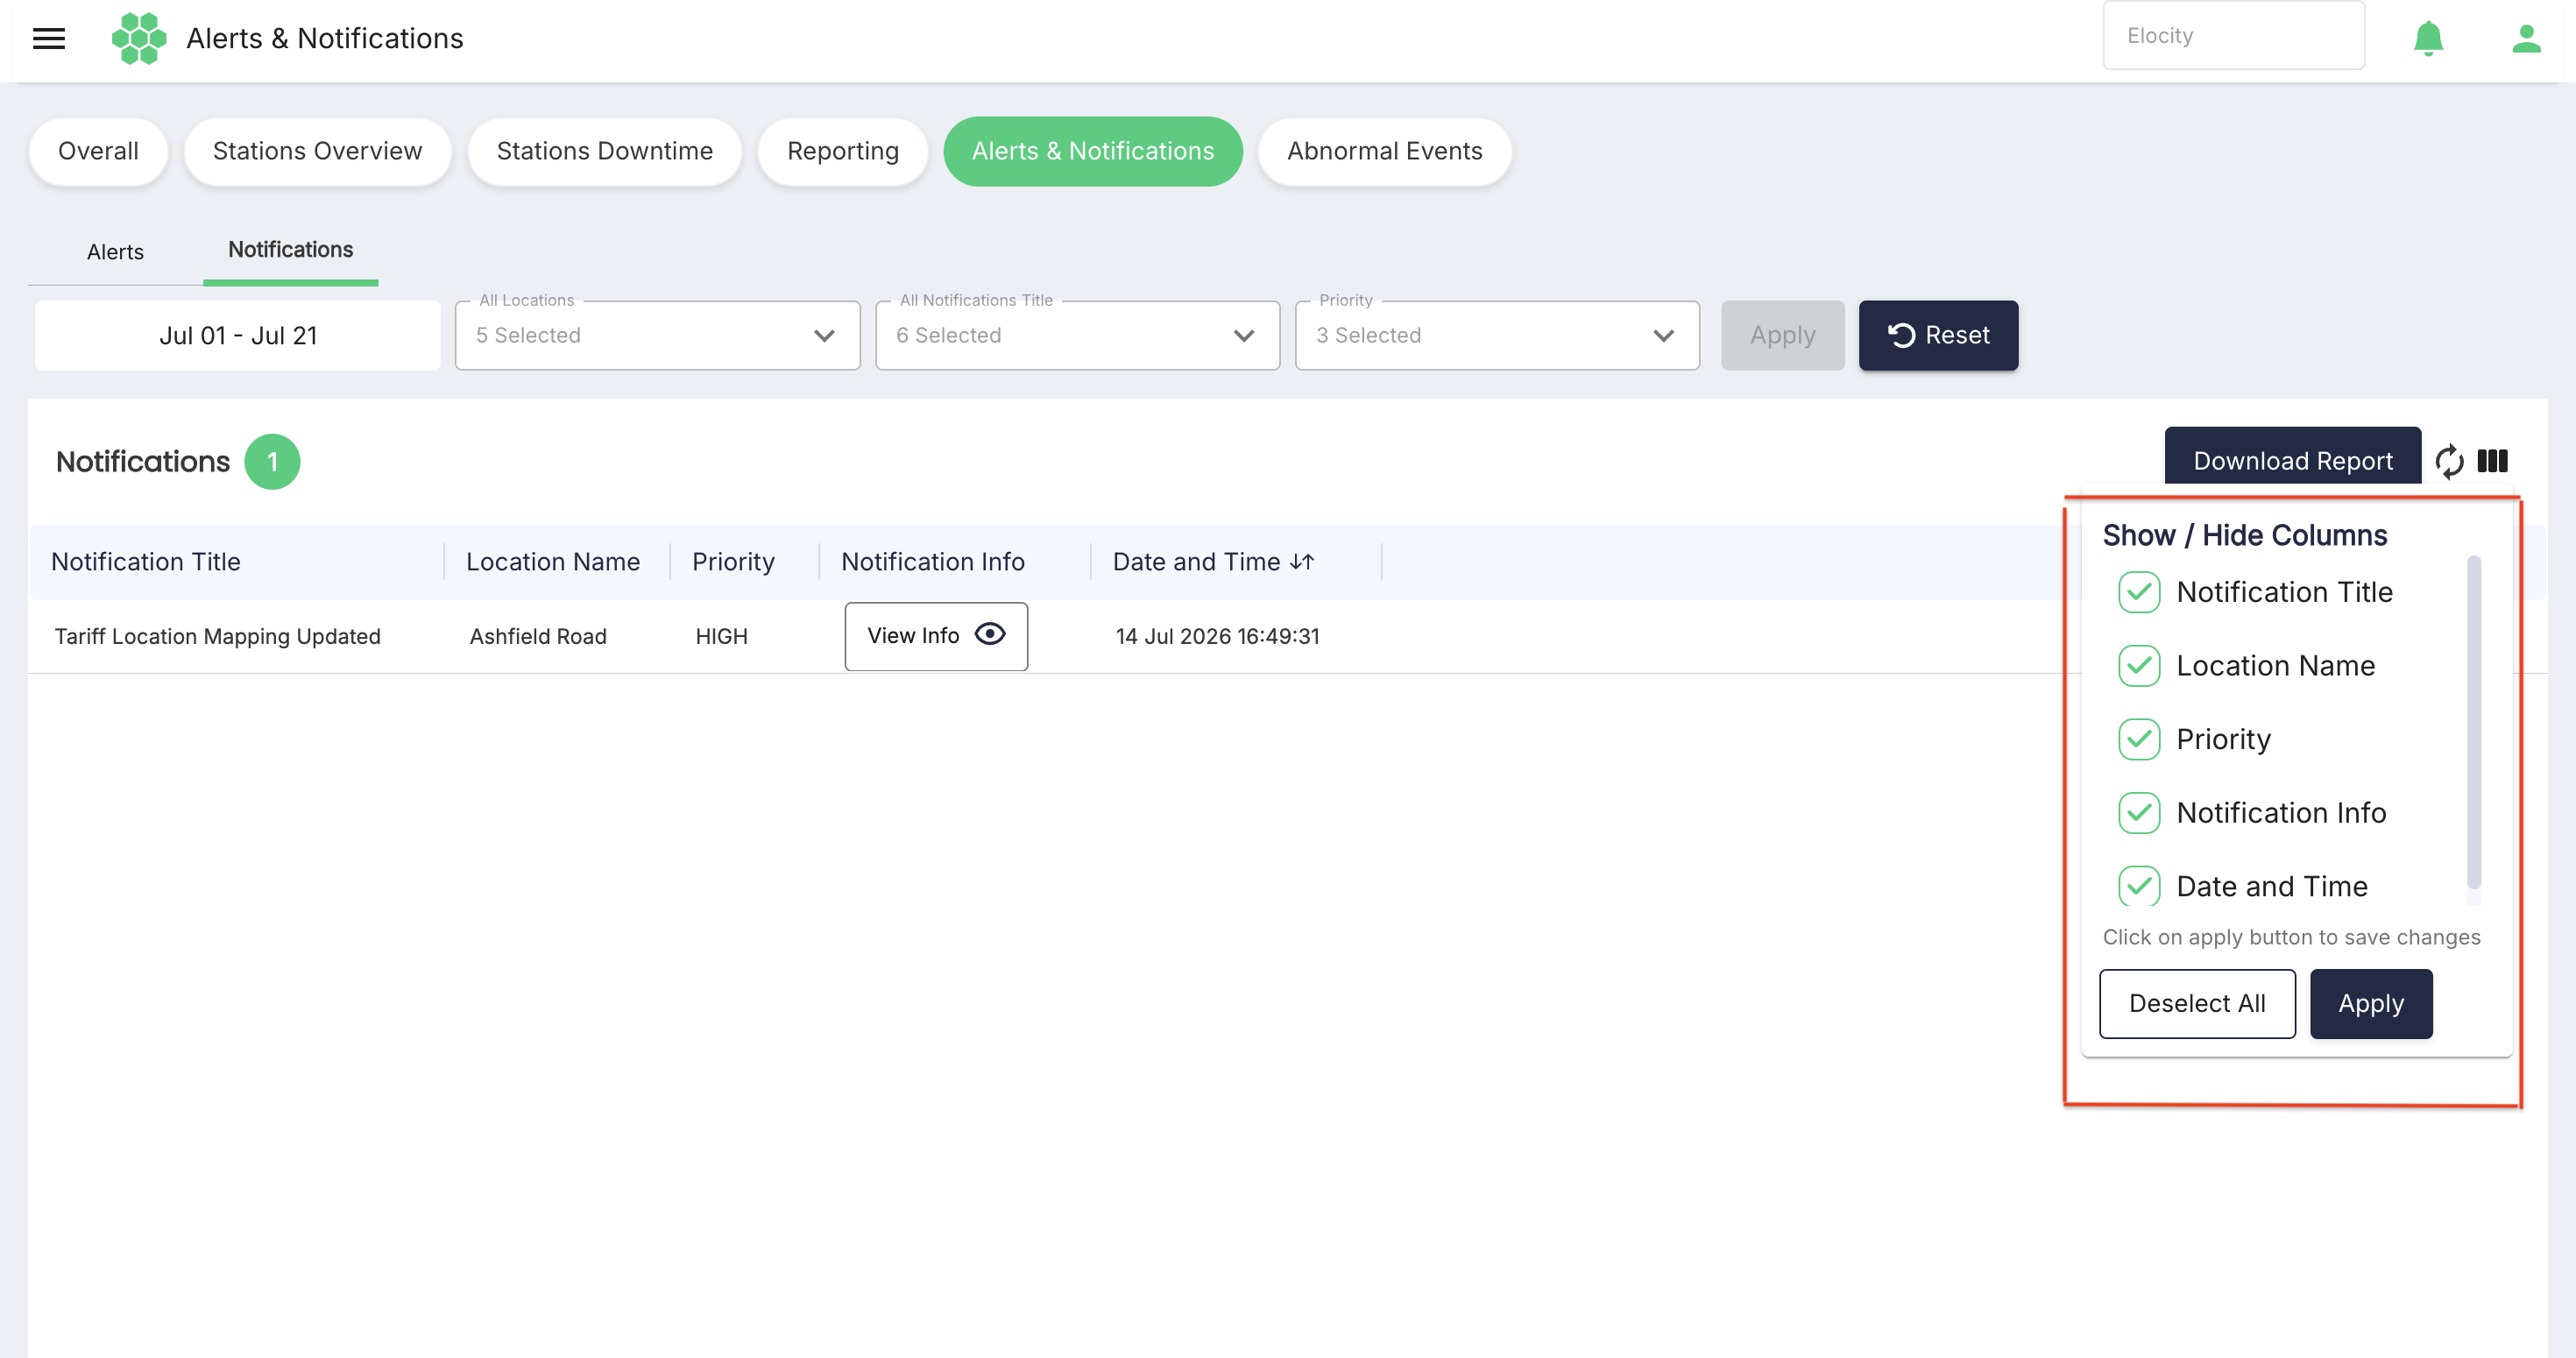
Column visibility changes the on-screen layout; it does not change the underlying records.
Downloading records
Select Download Report to export records in CSV format for offline review or operational record keeping. The export contains all records that match the selected filter options, including records that have not yet been loaded into view through infinite scrolling. It is not limited to the rows currently visible on screen.
Before downloading:
- Confirm the selected business and tab.
- Set the required date range.
- Select the required chargers or locations, titles, and priorities.
- Select Apply.
- Review the record counter and visible results.
- Select Download Report.
Handle exported operational records in accordance with the organization's data-retention and sharing policies.
Recommended operational workflow
- Select the required business.
- Select Alerts for charge-point events or Notifications for location-level operational and informational updates.
- Choose the required preset or custom date range.
- Select the relevant chargers or locations.
- Select the required event titles and priorities.
- Select Apply and review the counter.
- Use grid sorting or column controls to organize the results.
- Select View Info to read the complete description of a relevant record.
- Use the Charge Point ID, location, timestamp, and description to correlate an alert with the applicable station status, charging-session data, or technical logs.
- Select Refresh when reviewing a recent or changing condition.
- Select Download Report when the filtered records must be retained or shared with an authorized team.
Interpretation notes
- A record represents a generated event or update; it does not by itself prove the underlying technical cause.
- The presence of an alert does not confirm that the associated condition is still active. Check the latest station status and supporting logs.
- The same charger or location can appear in multiple records when separate events occur.
- Use the priority, title, timestamp, and description together. Do not determine the required response from the title alone.
- An empty grid means that no records match the current business, date range, and filters.
- Grid and detail-dialog timestamps use the browser's timezone, while technical logs use UTC.
- The counters and header bell track unread records and decrease as records are read in the web application.
- Infinite scrolling means that additional matching rows can exist beyond those currently visible; the CSV export includes the complete filtered result set.
- Totals can differ between users because of business assignments and permissions.
- Refresh the page data before making a time-sensitive operational decision.