Abnormal Events
Purpose
The Abnormal Events page provides a historical view of events that should not normally occur within the EV charging network but have been detected by the platform. These events can require operator attention to improve the EV-driver experience and protect revenue. The page brings together the affected location, charger and connector references, event timestamp, event category, technical payload, readable description, and EVSE manufacturer information.
Use this page to locate abnormal records, examine the underlying event data, identify repeated patterns, correlate an event with charger or transaction logs, and download records for authorized operational or technical review.
An abnormal-event record identifies a condition that the platform classified as abnormal. It does not, by itself, establish the root cause or confirm that the condition is still active.
Some abnormal events can also appear as Alerts. Alerts provide operational awareness, while the Abnormal Events page provides the broader technical record of events that should not normally occur and may require operator investigation.
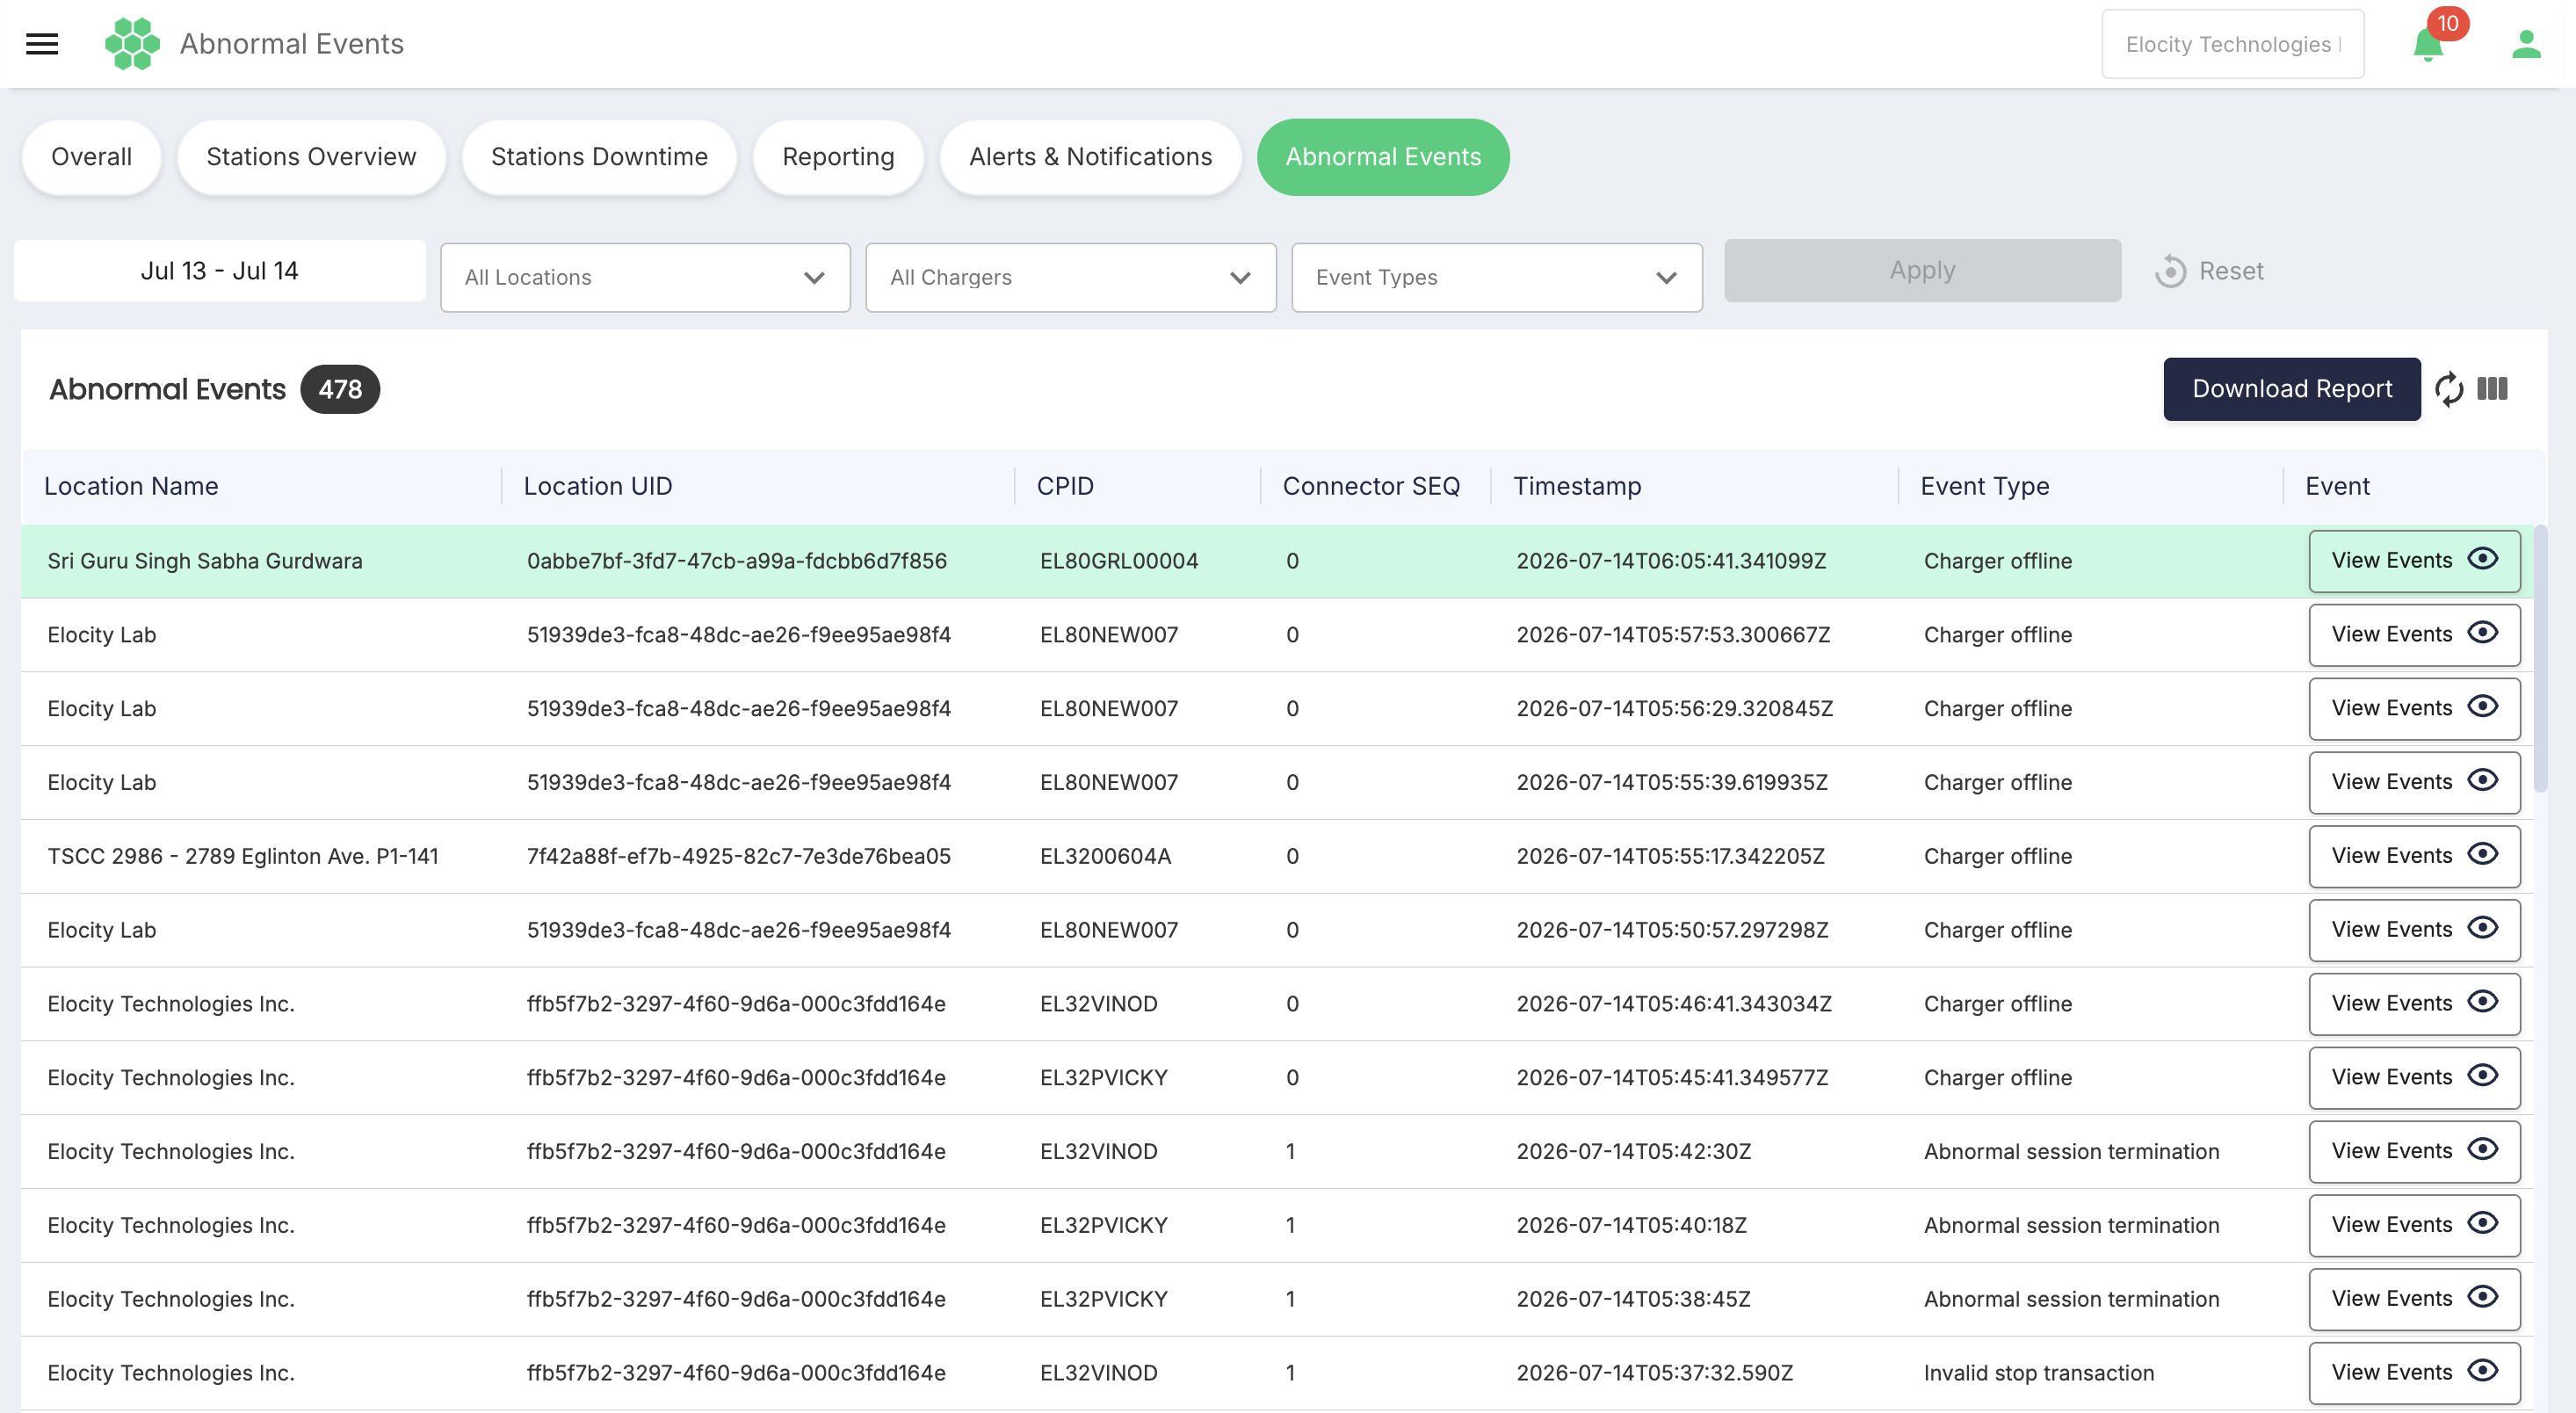
Accessing the page
- Sign in to the HIEV portal.
- Open Dashboard.
- Select Abnormal Events.
The businesses, locations, chargers, and records available on the page depend on the user's assignments and permissions.
Selecting the business scope
Use the business selector in the page header to choose the business whose abnormal events you want to review. The selected business determines the locations, chargers, and event records available to the page filters.
Confirm the selected business before beginning an investigation or downloading a report.
Page filters
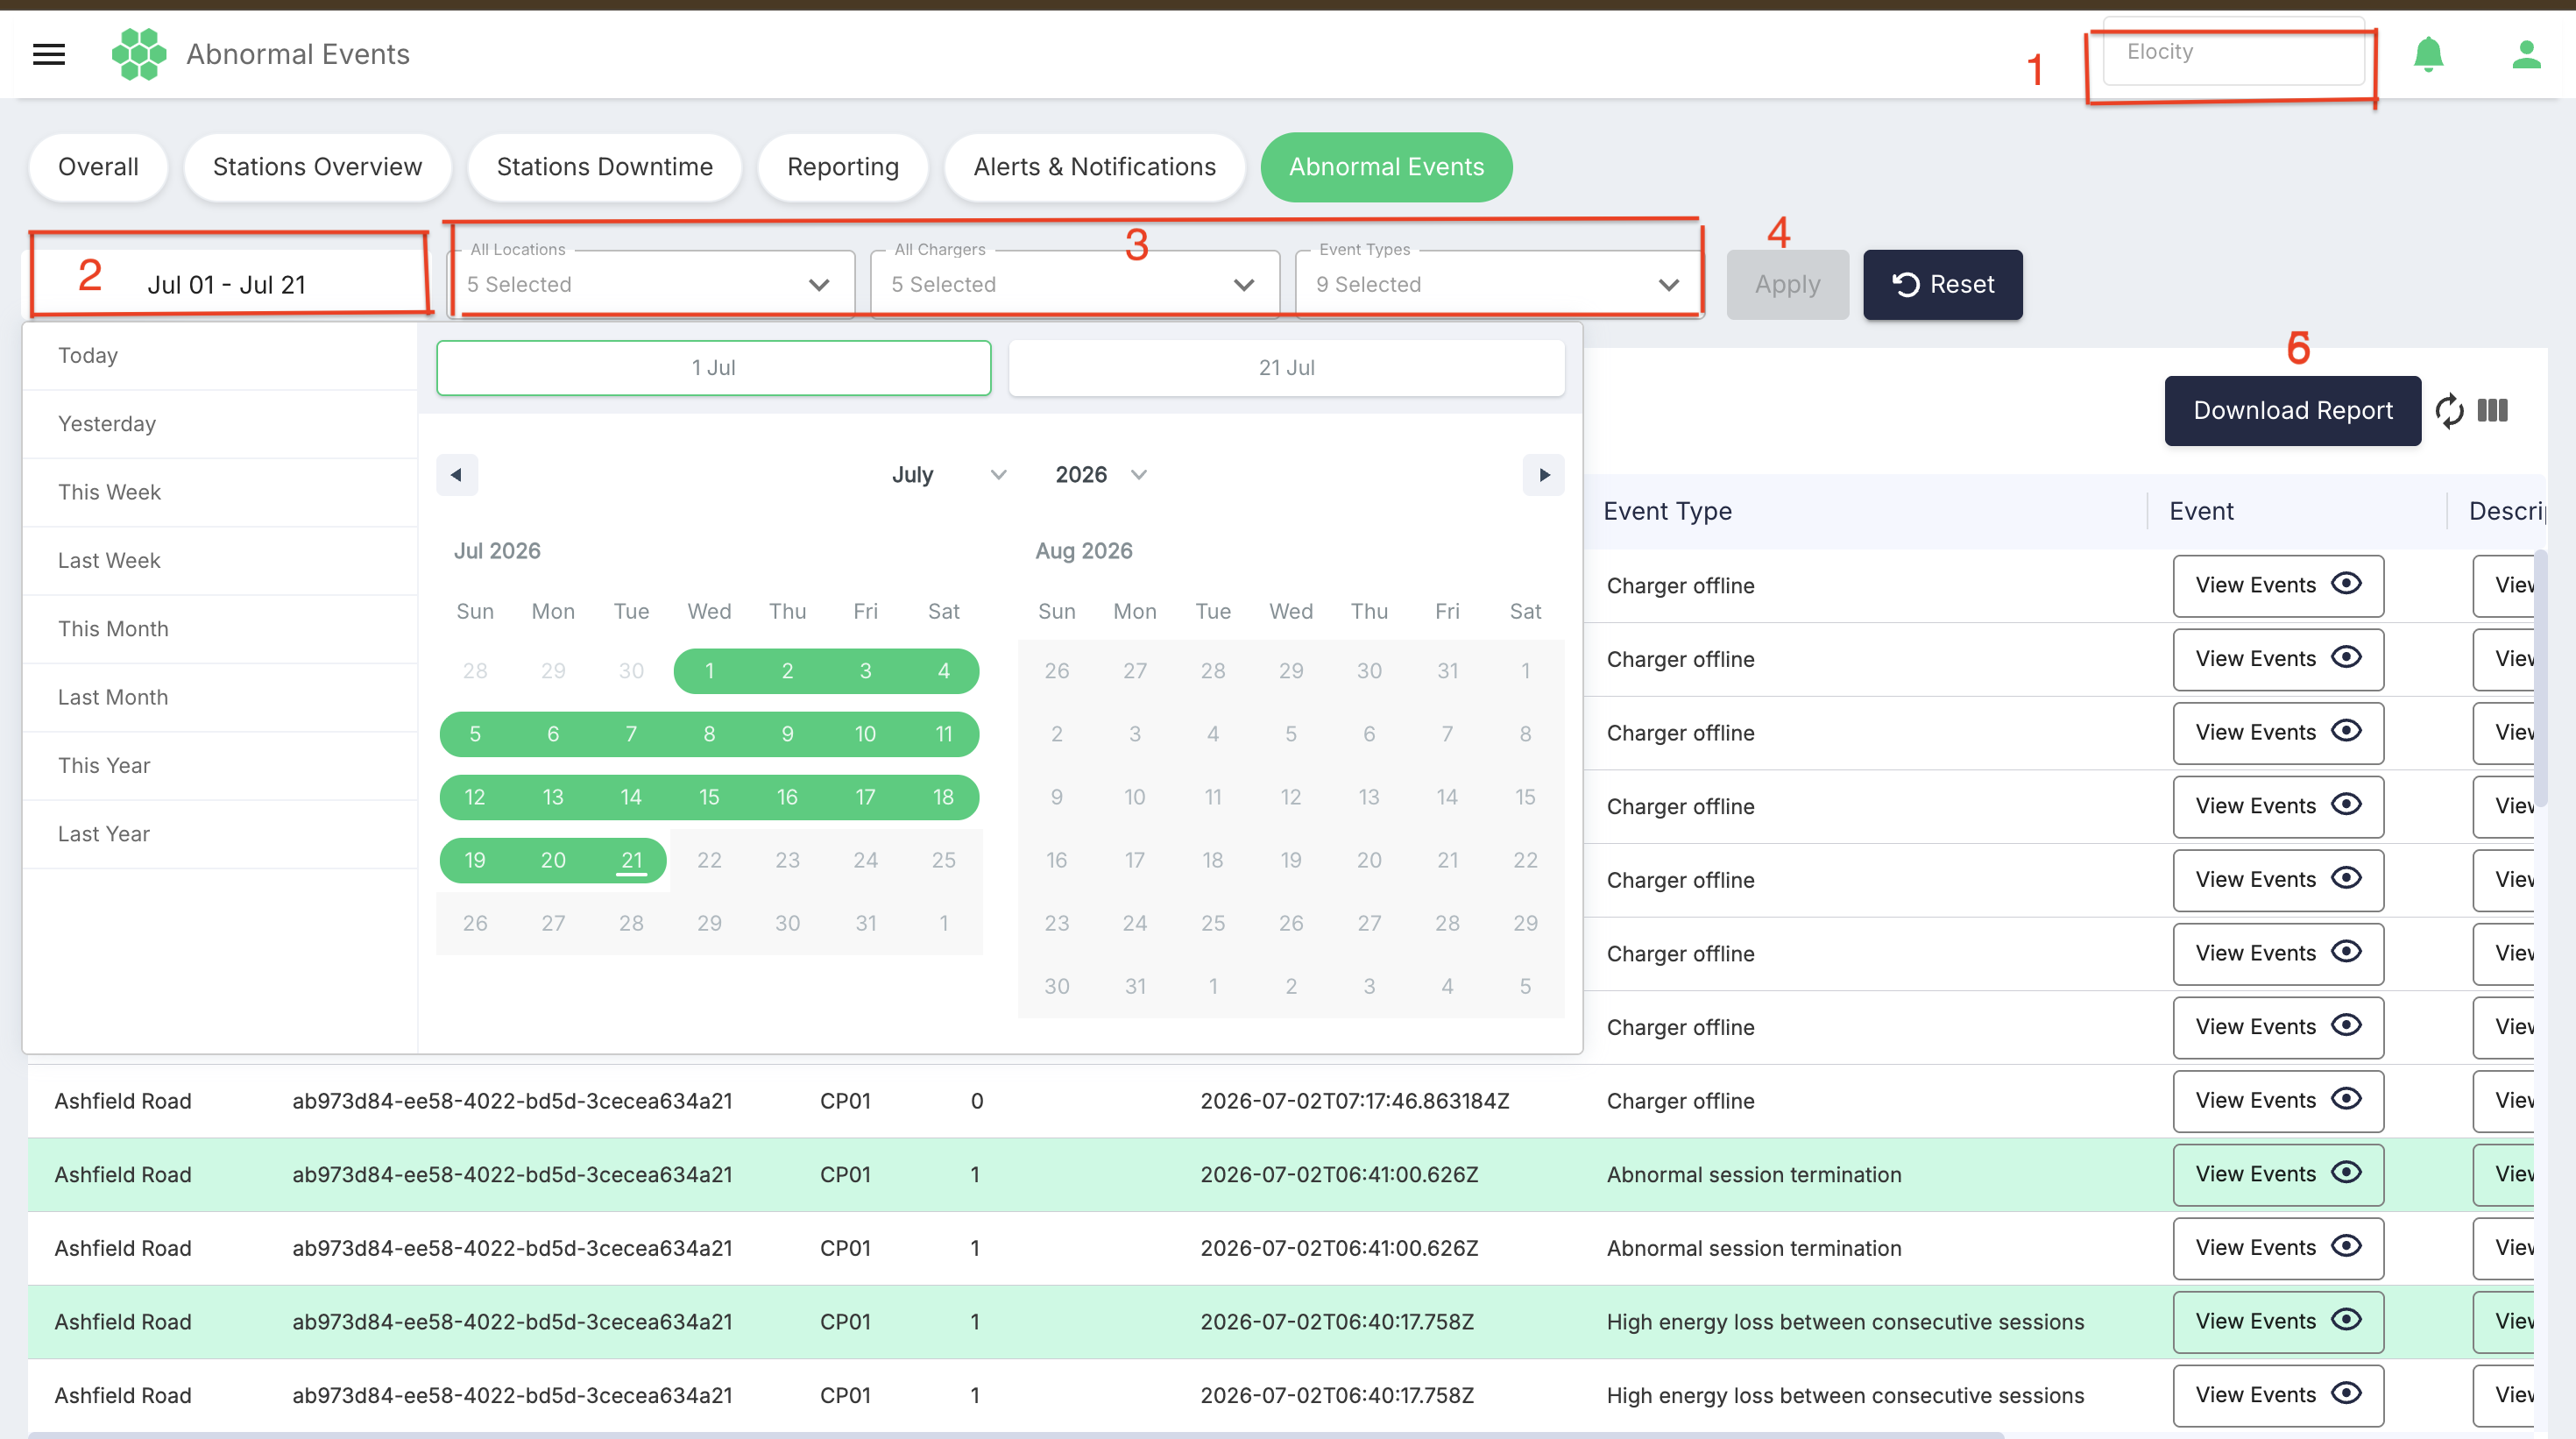
The filter bar contains a date range and three multi-select dropdowns. After changing one or more filters, select Apply to update the results. Select Reset to clear the page-level selections and return to the default filter state.
Date range
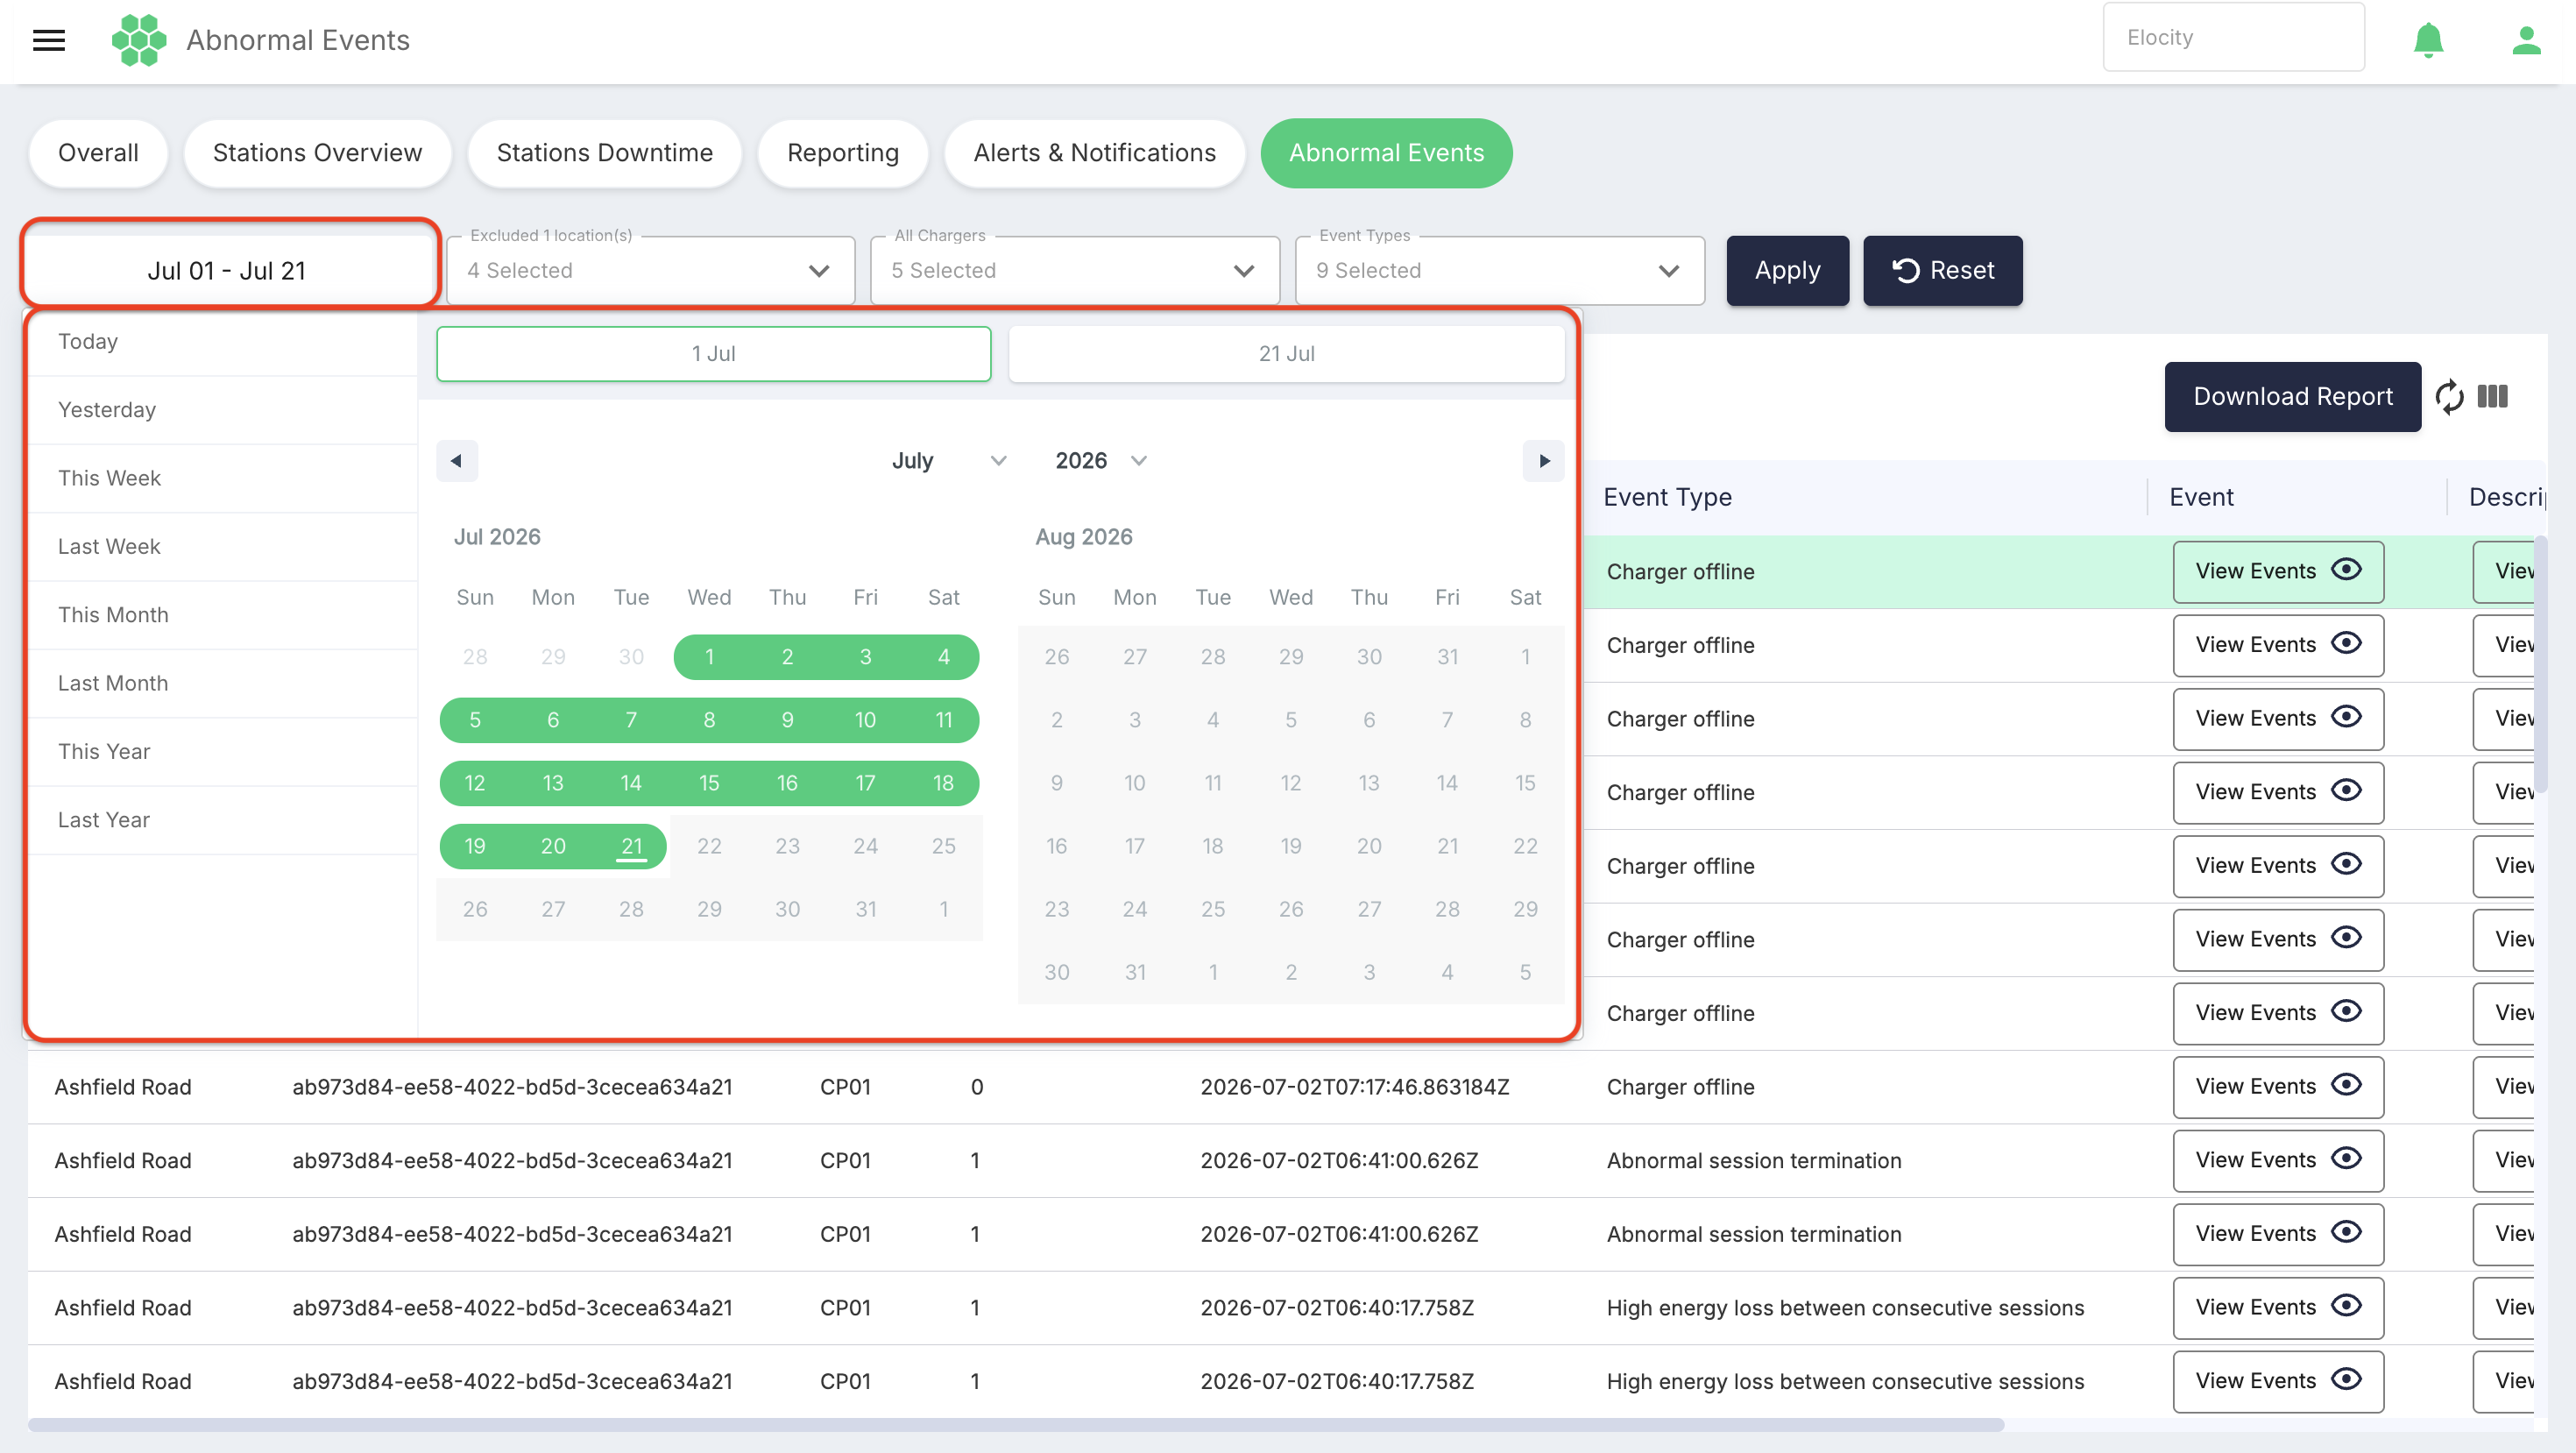
Select the displayed date range to open the two-month calendar. The following predefined periods are available:
- Today
- Yesterday
- This Week
- Last Week
- This Month
- Last Month
- This Year
- Last Year
For a custom period, select the start and end dates in the calendar. Use the month and year selectors to move directly to another period.
The selected date range is evaluated using the browser's timezone. The event timestamps recorded in the grid are event-log values and can be expressed in UTC. Convert both values to the same timezone when correlating events with another portal page or external system.
All Locations
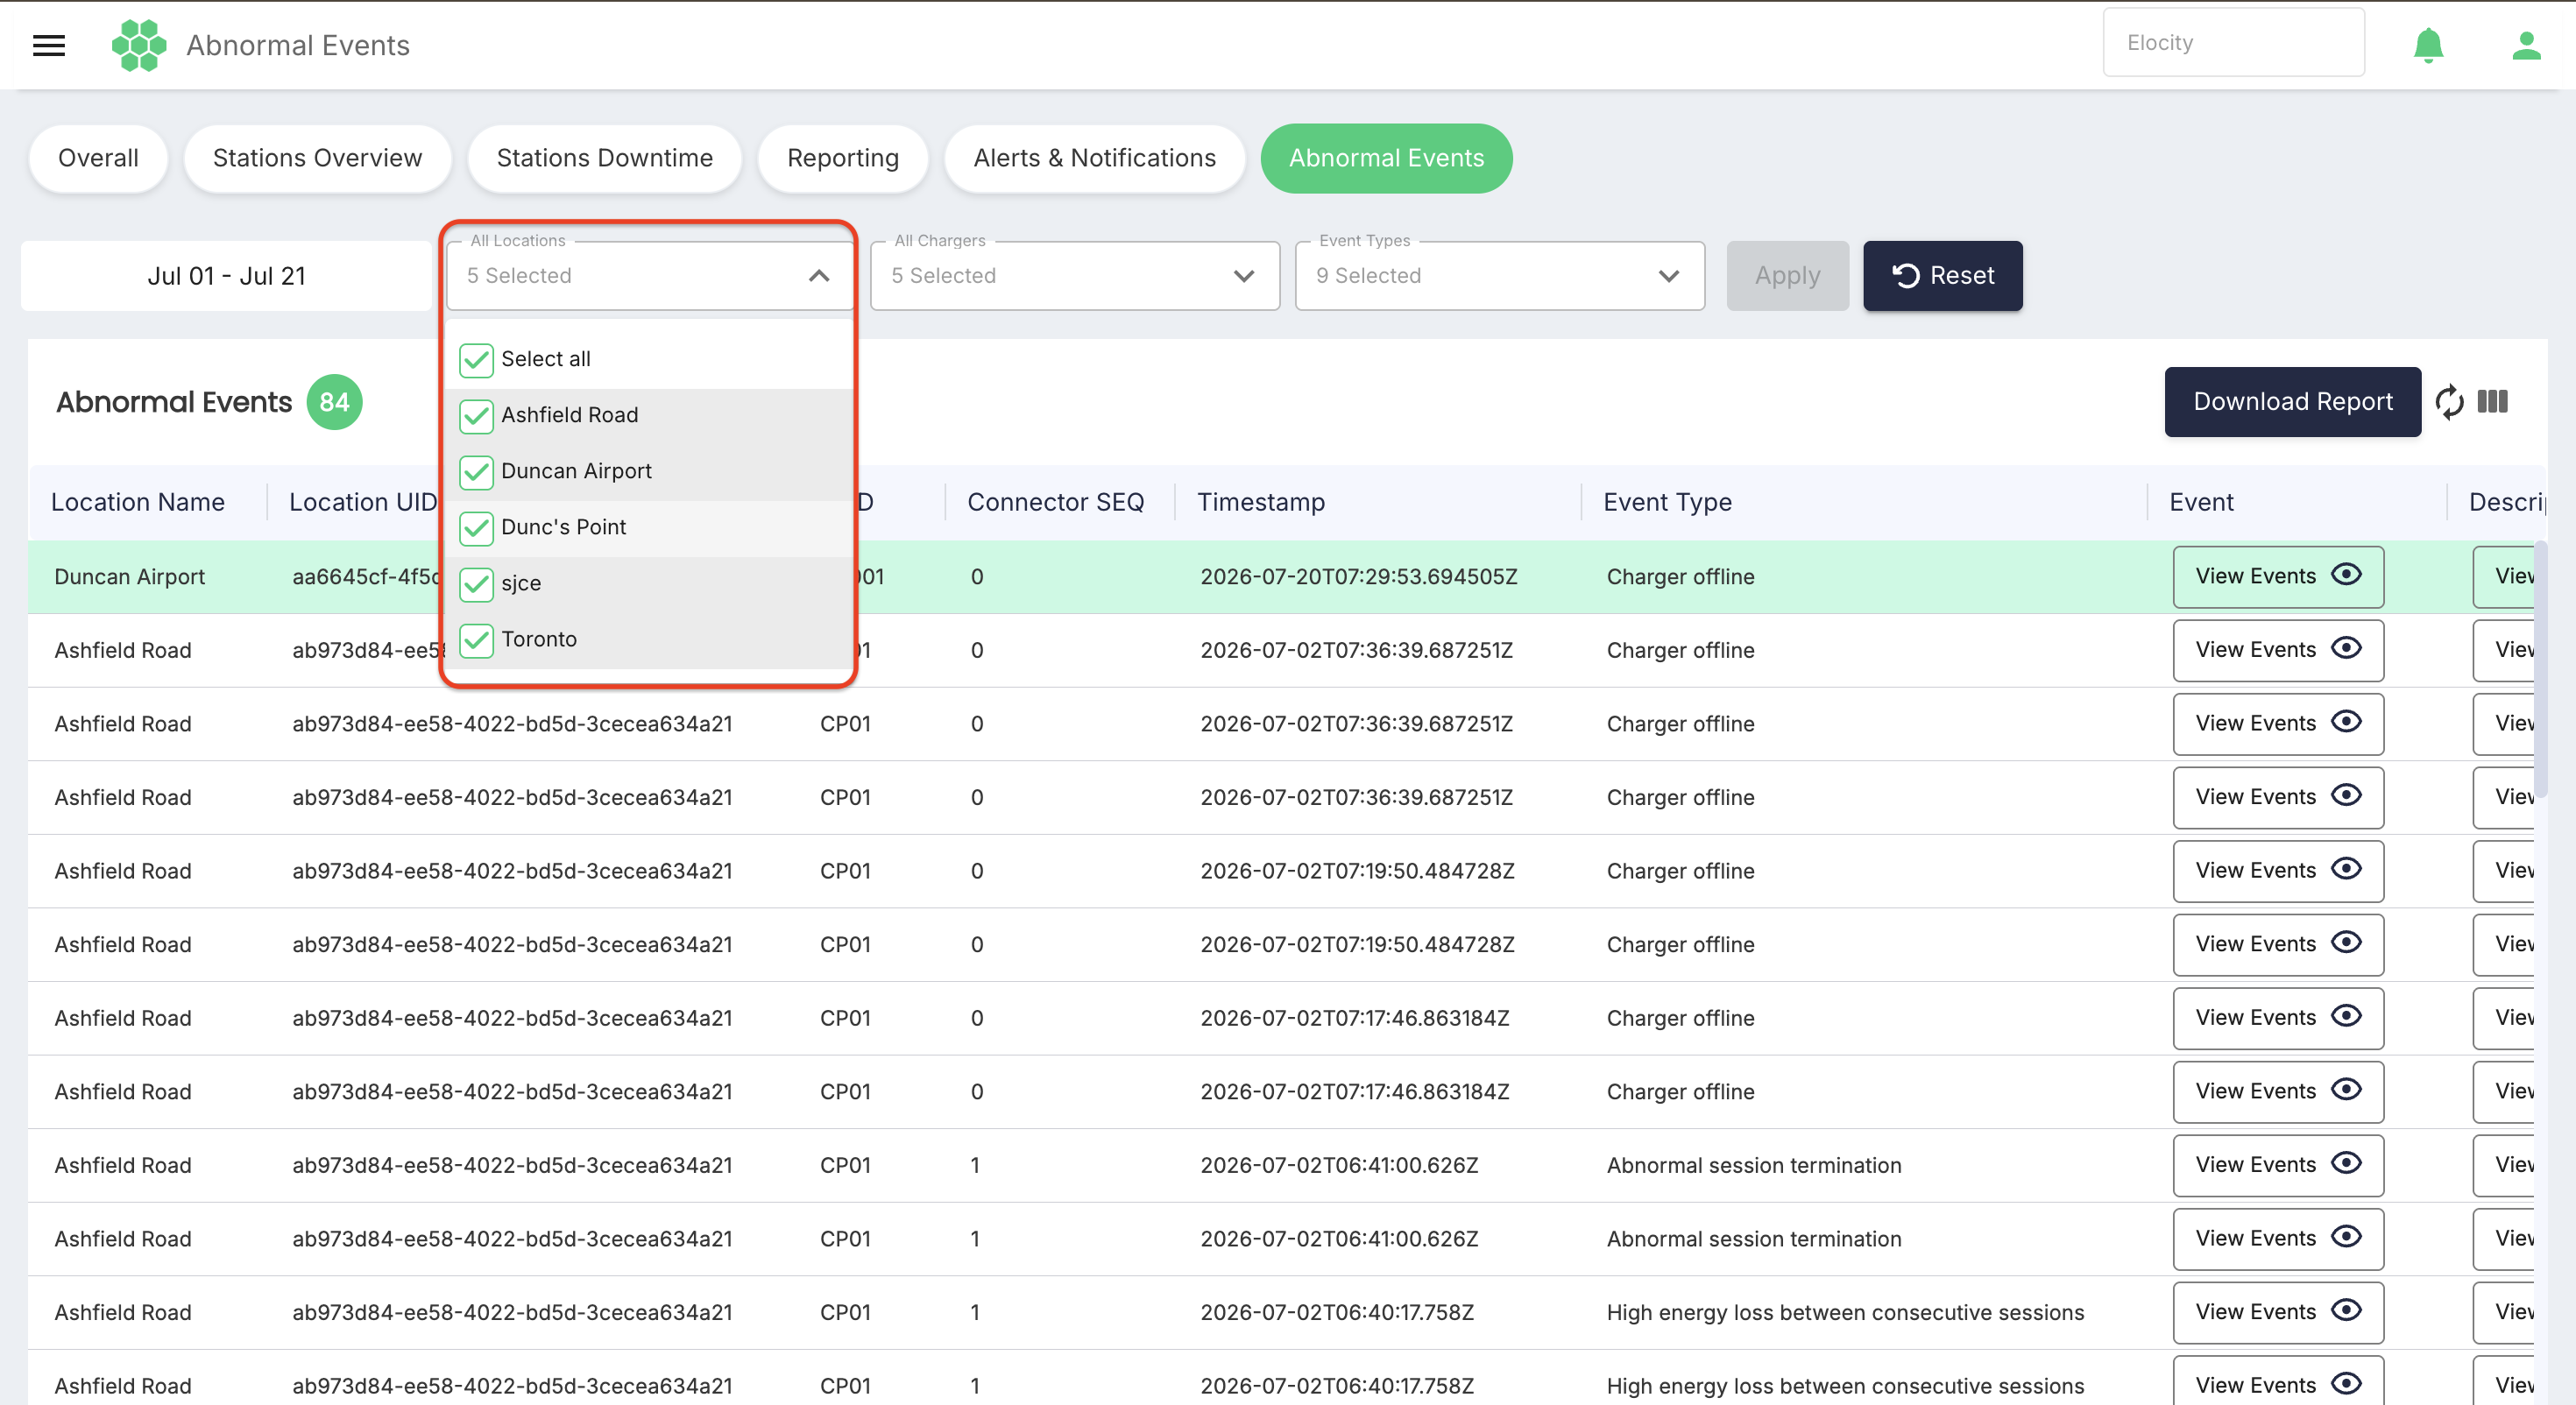
The All Locations dropdown limits the results to one or more locations within the selected business context.
- Open All Locations.
- Type in the field to locate a location or scroll through the available entries.
- Select the checkbox beside each required location.
- Use Select all to include every available location.
- Select the page-level Apply button.
All Chargers
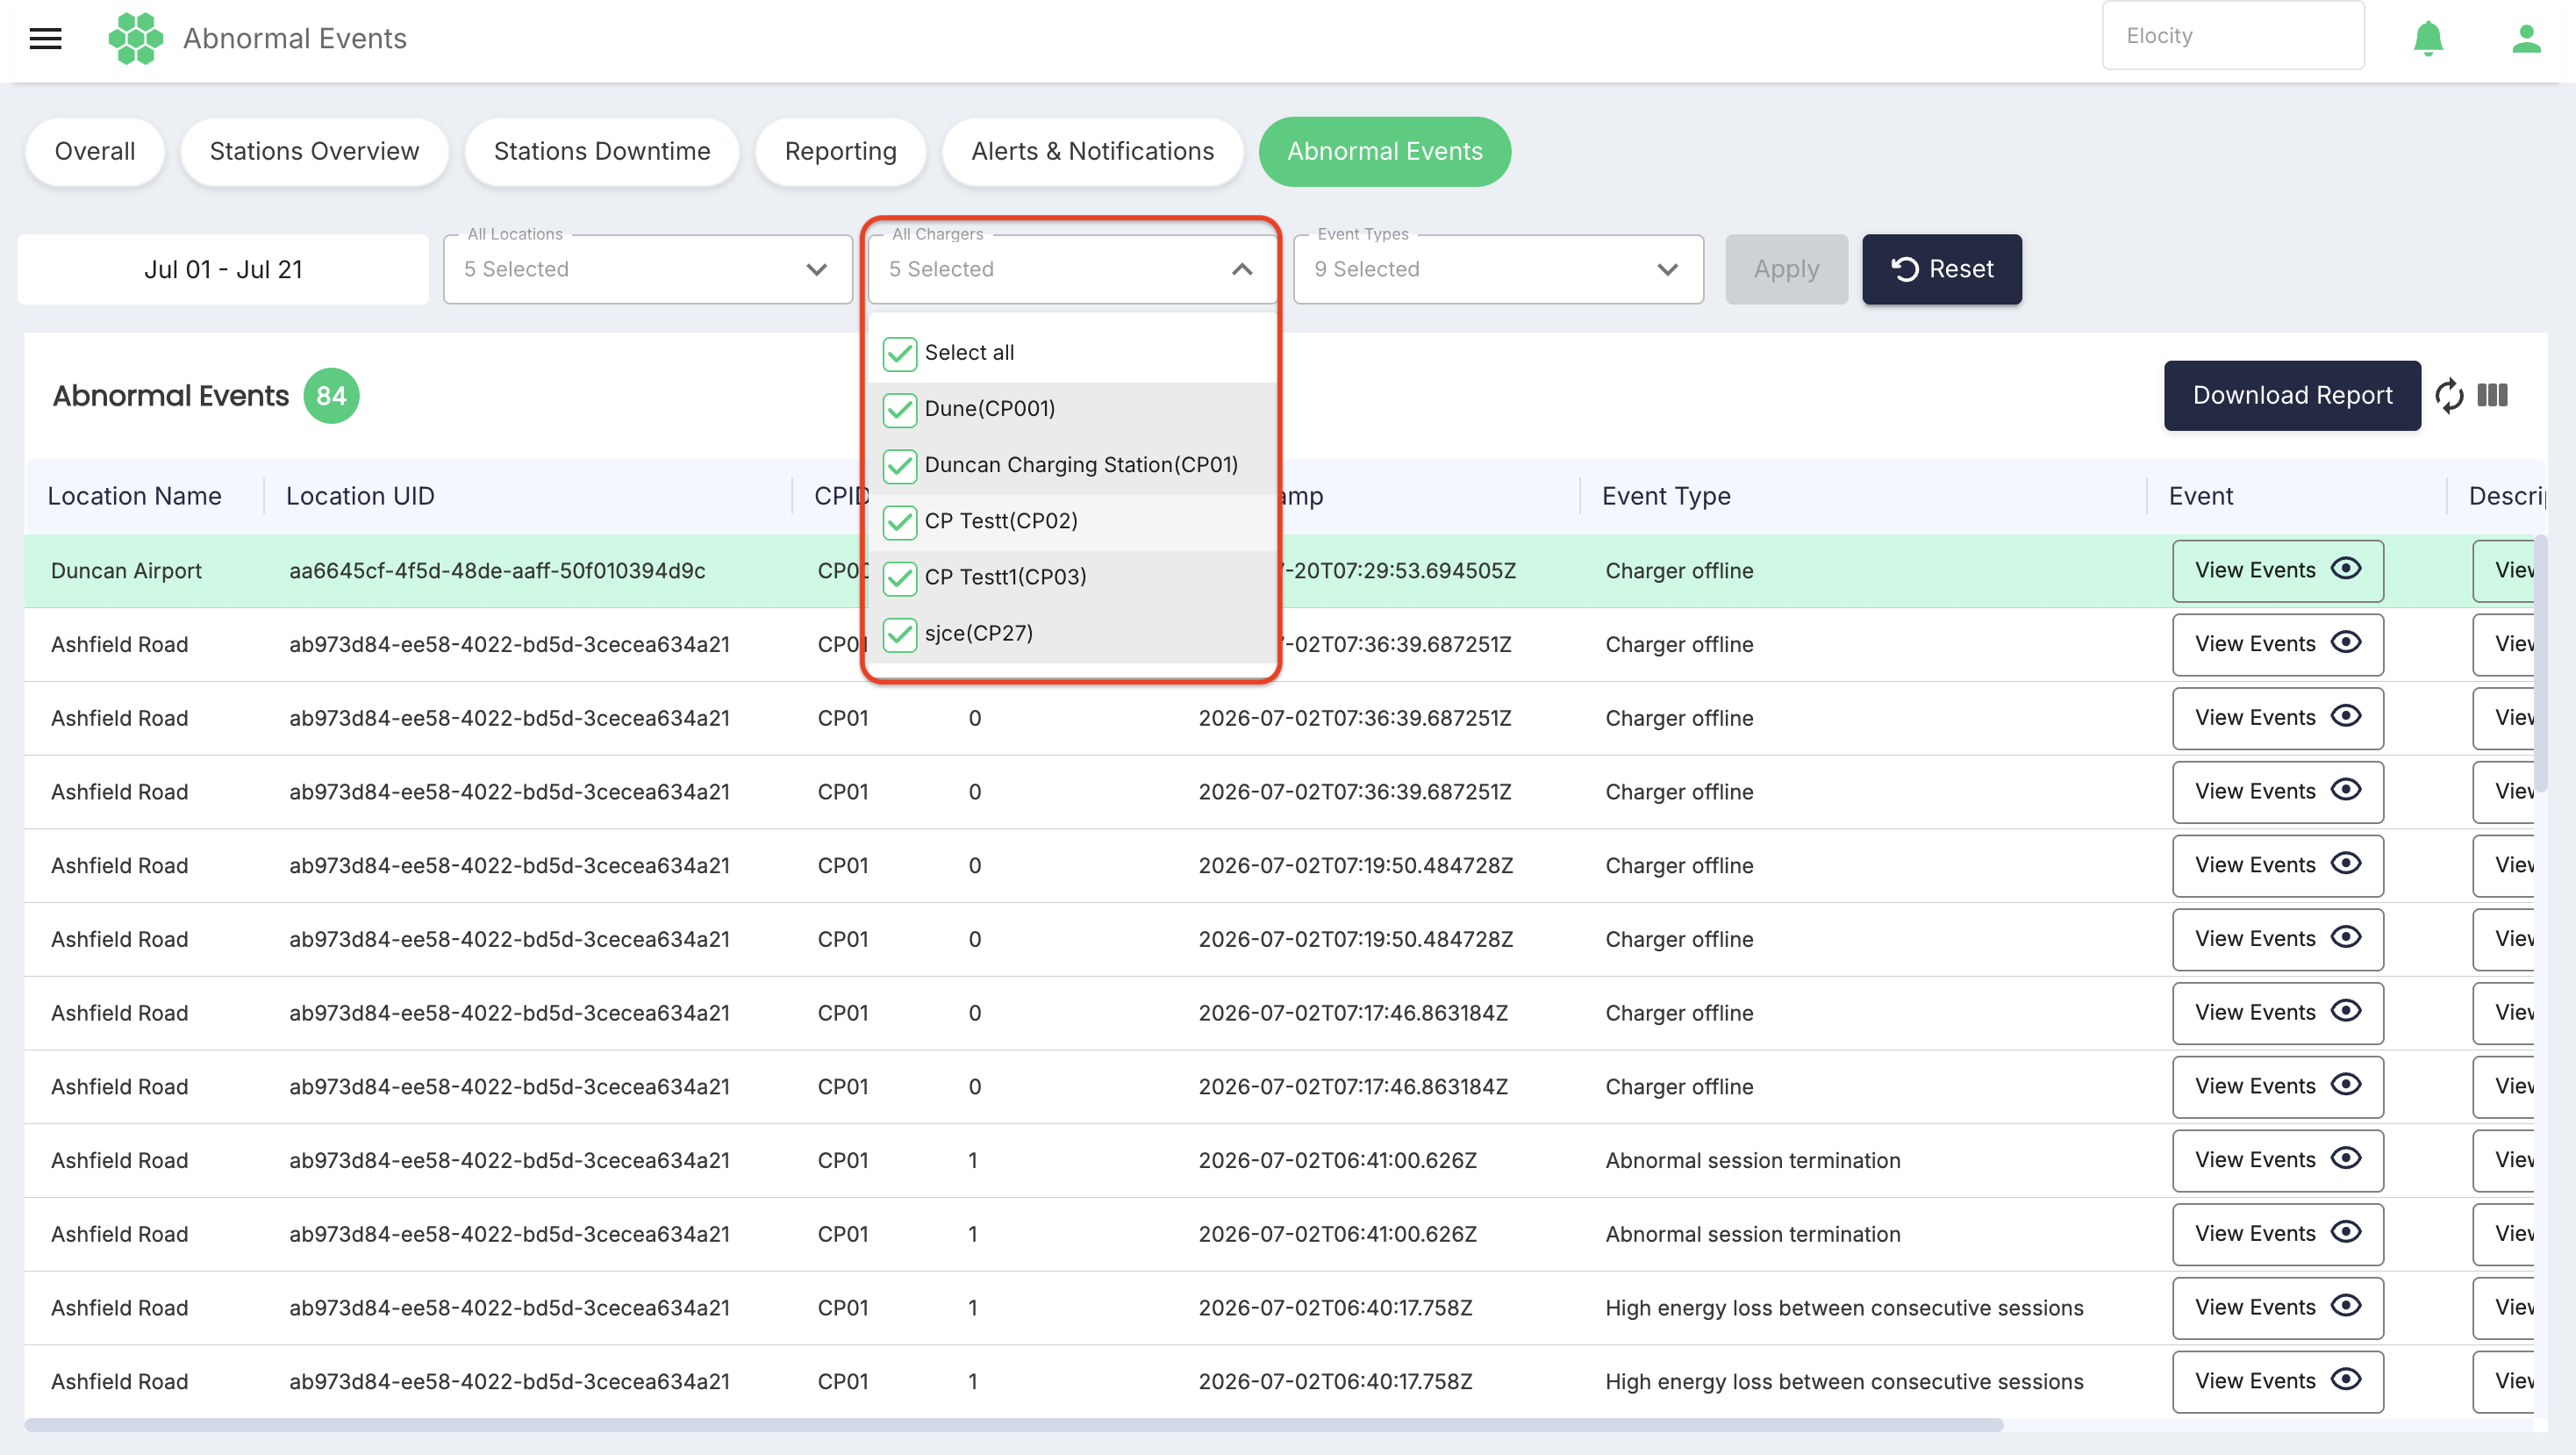
The All Chargers dropdown limits the results to one or more chargers. Each option is displayed as the charger or station name followed by the Charge Point ID in parentheses, for example Station Name(CPID).
- Open All Chargers.
- Type in the field to locate a charger or scroll through the available entries.
- Select the checkbox beside each required charger.
- Use Select all to include every available charger.
- Select the page-level Apply button.
Event Types
The Event Types dropdown limits the results to one or more abnormal-event categories. It supports individual checkboxes and Select all.
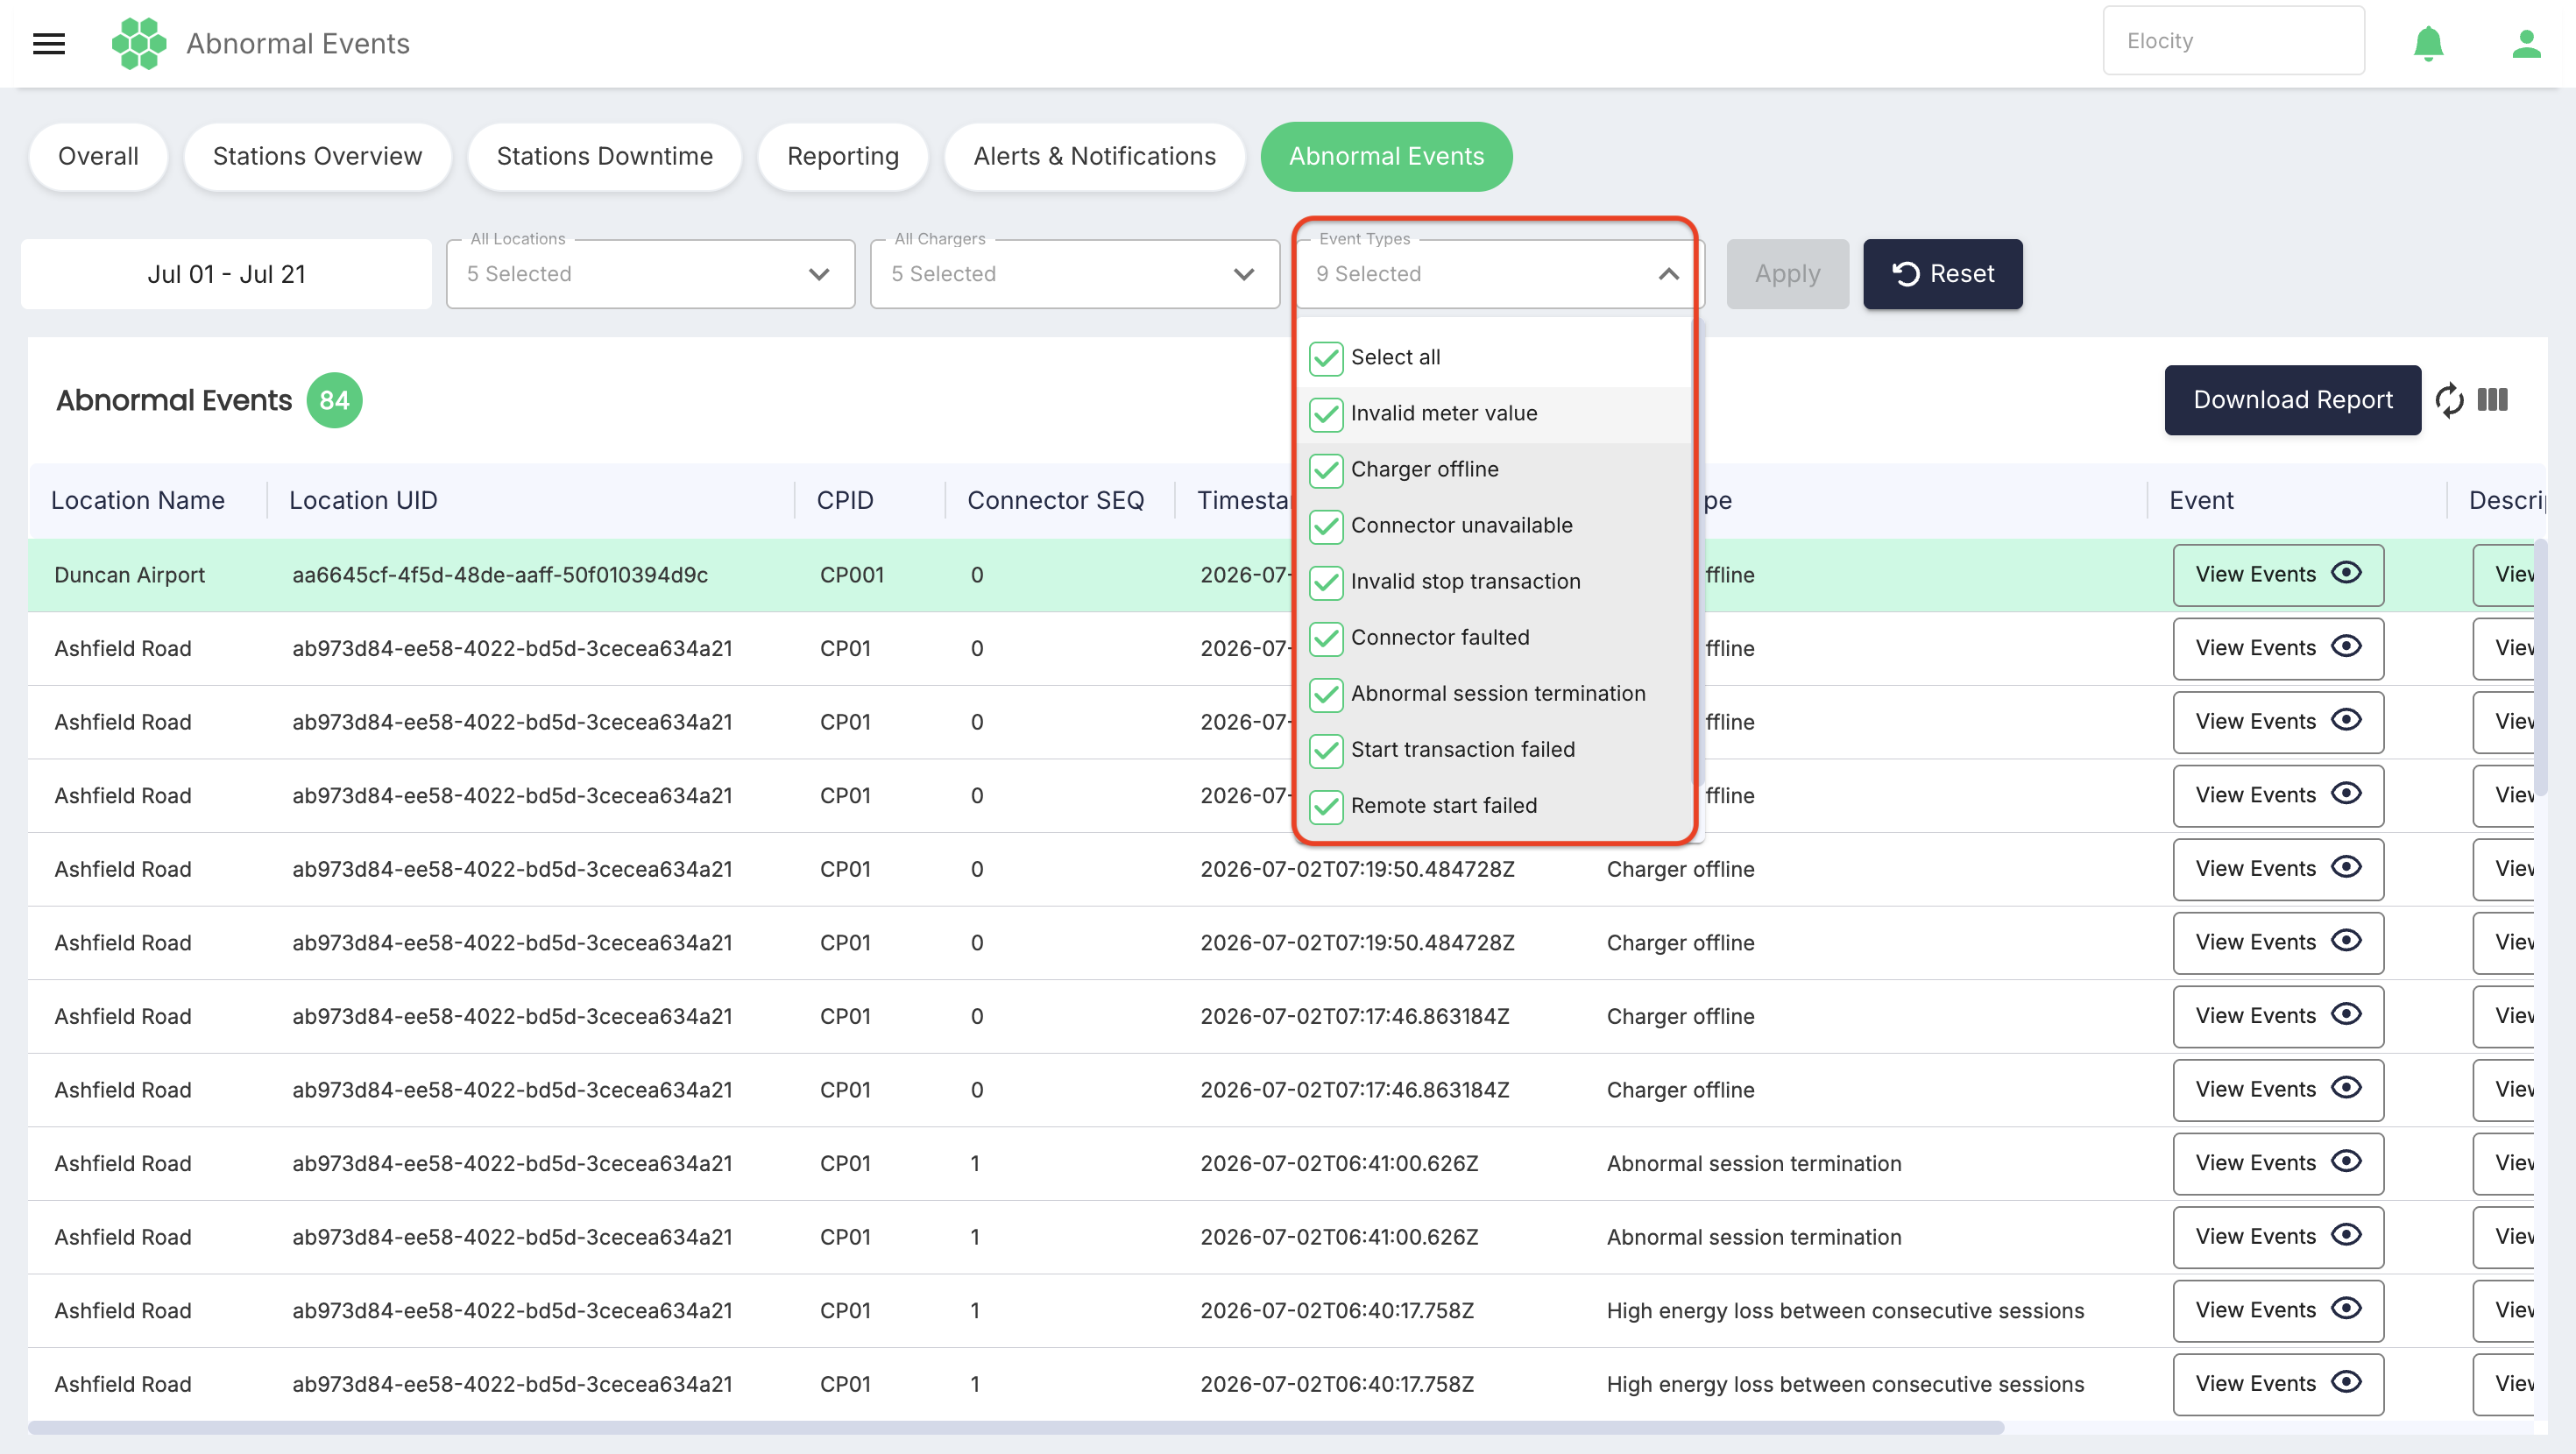
The current live page provides the following event types:
| Event type | What the category identifies |
|---|---|
| Invalid meter value | A meter value that the platform classified as invalid. The exact validation rule is not displayed on the page. |
| Charger offline | A record generated when the platform classified a charger as offline. |
| Connector unavailable | A record associated with a connector being classified as unavailable. |
| Invalid stop transaction | A stop-transaction event or payload that the platform classified as invalid. |
| Connector faulted | A record associated with a connector being classified as faulted. |
| Abnormal session termination | A charging transaction that the platform classified as terminating abnormally. |
| Start transaction failed | A charging transaction that did not complete its start process. |
| Remote start failed | A remotely initiated charging start that did not complete successfully. |
These labels describe the platform categories shown in the dropdown; they should not be used to assign a technical root cause without reviewing the event payload, description, station status, and supporting logs.
The platform triggers these event categories from the charger or connector state and from the quality of data received by the server from the charger. The applicable state or data condition depends on the selected event type.
Results counter
The number displayed beside Abnormal Events shows how many abnormal events occurred on the network for the selected business, date range, locations, chargers, and event types. Use it to understand the volume of matching records before and after changing filters.

Abnormal Events grid
Each row represents one abnormal-event record. The grid presents the following columns.
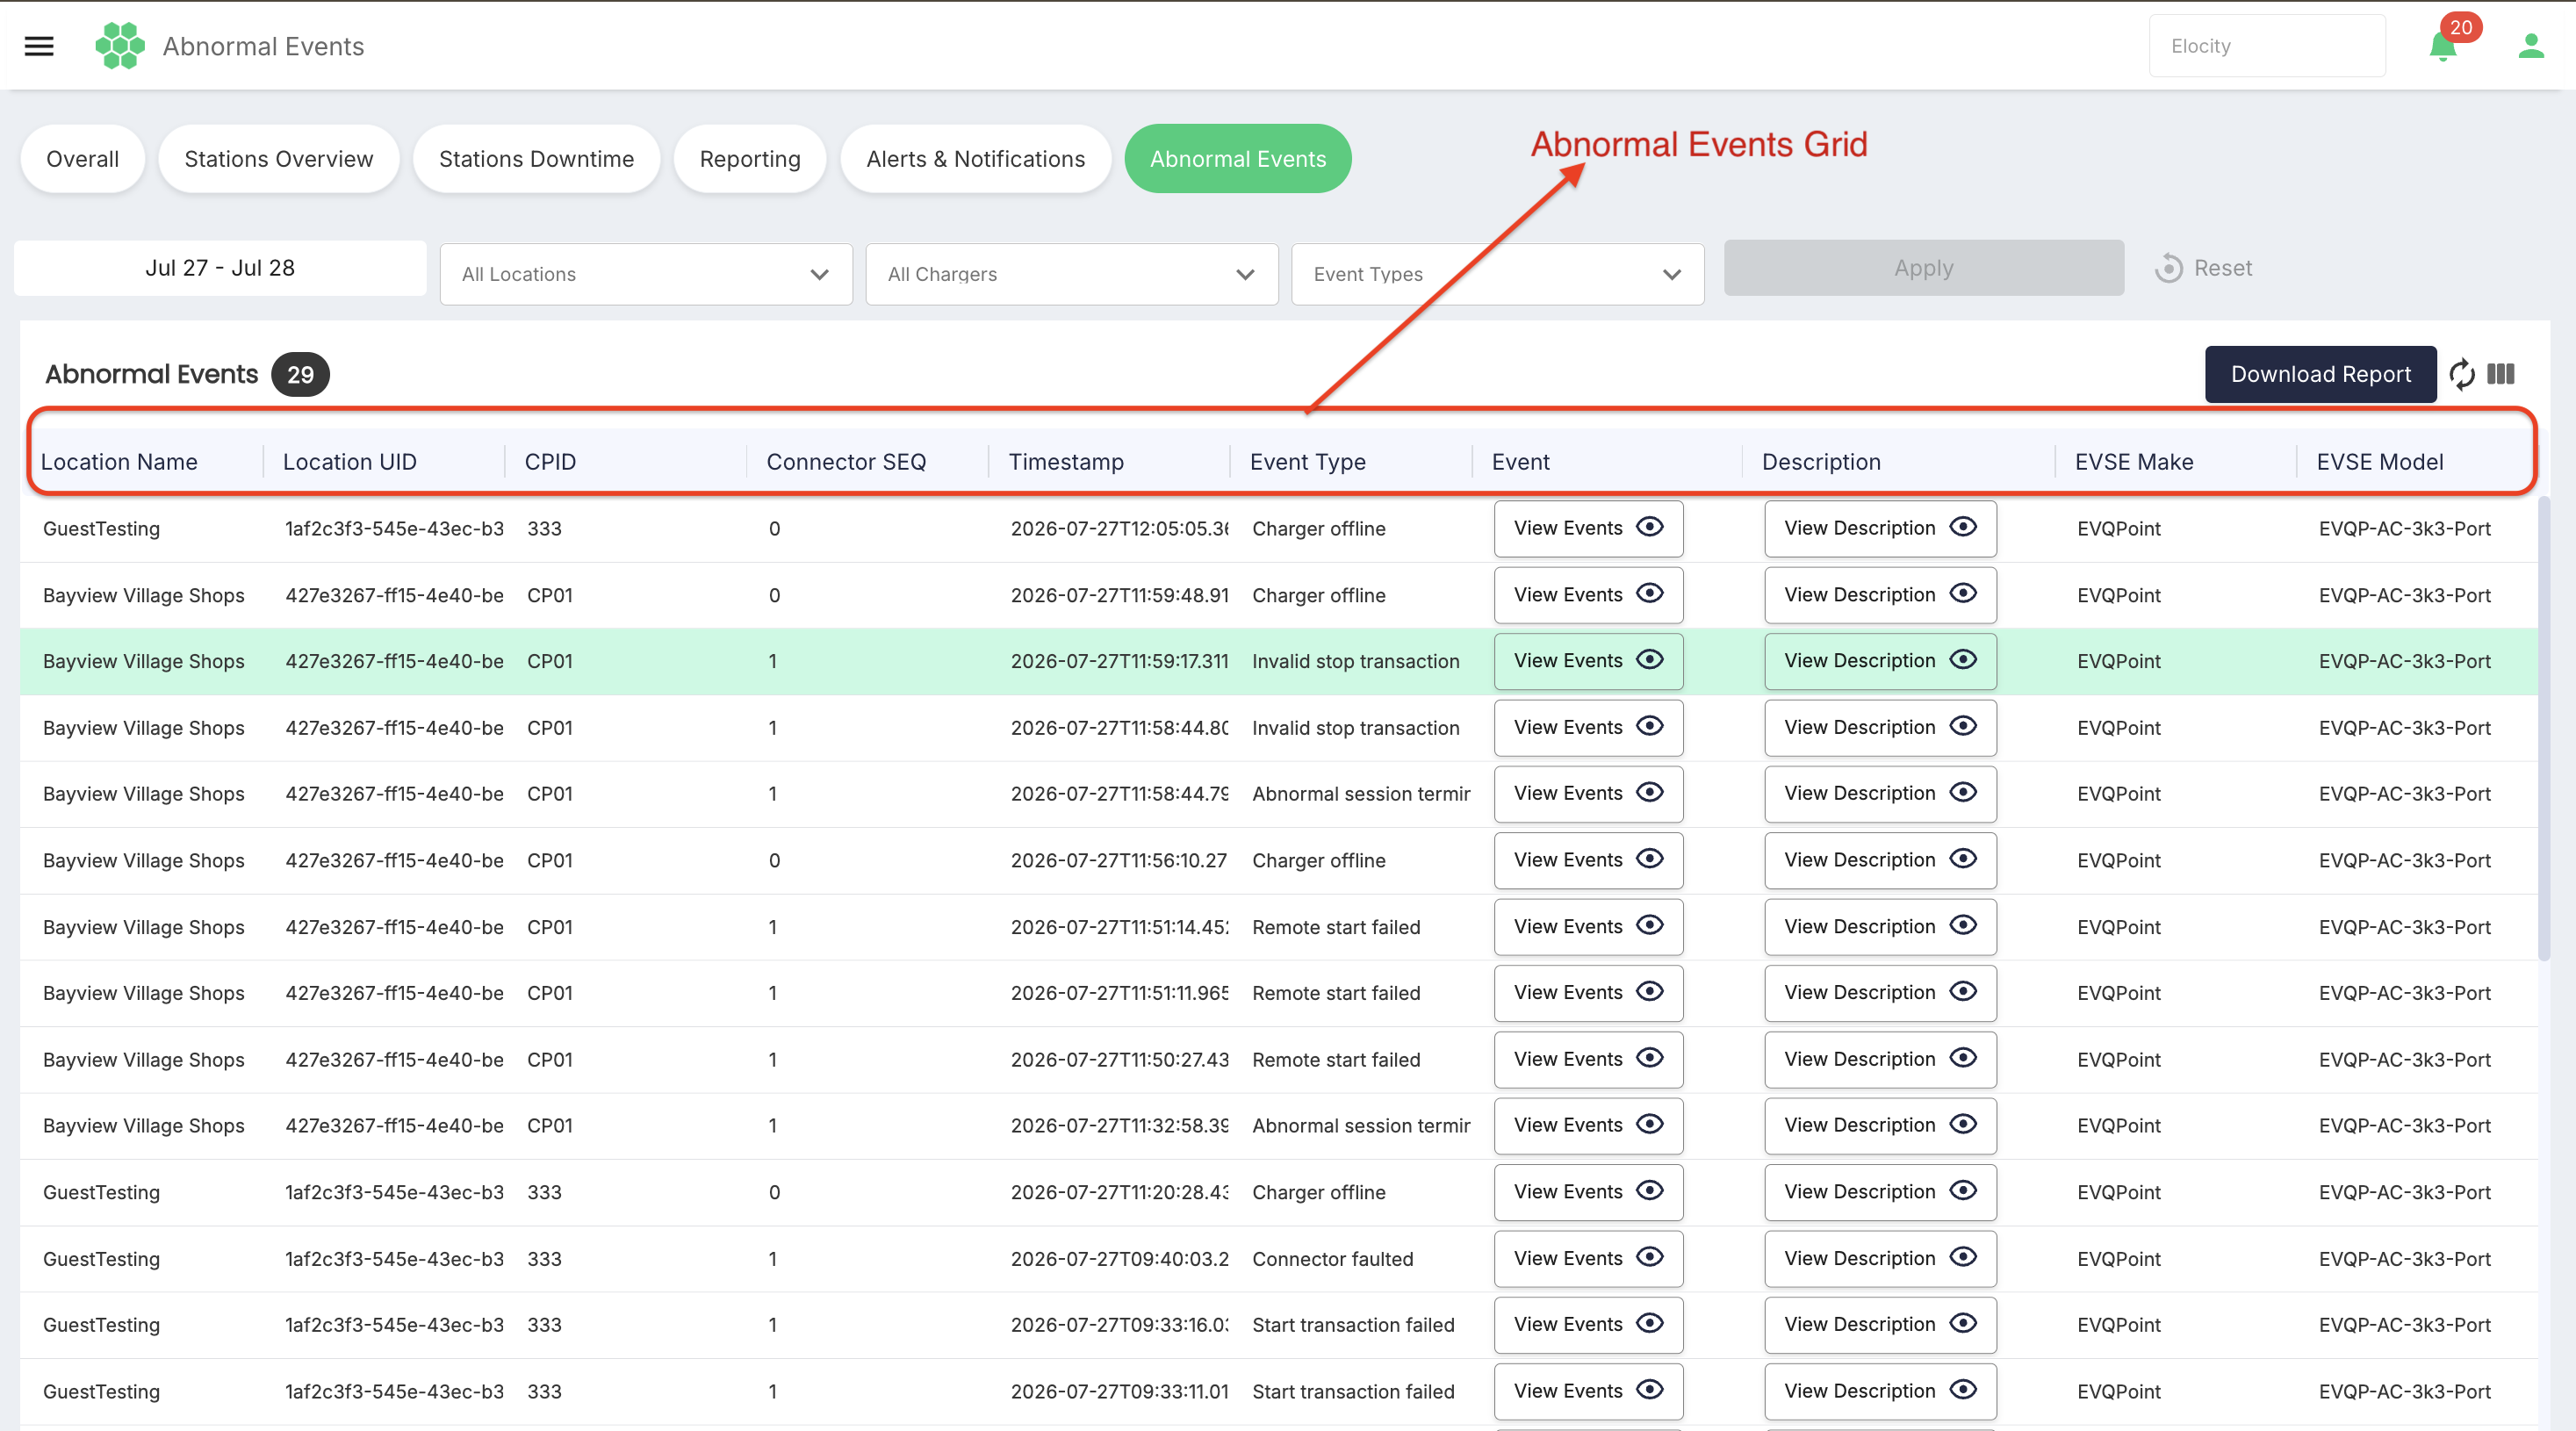
| Column | Description |
|---|---|
| Location Name | Shows the display name of the charging location associated with the event. |
| Location UID | Shows the location's platform identifier. The live records display this value as a UUID. Use it when the location name alone is not sufficient for correlating data between systems. |
| CPID | Shows the Charge Point ID of the charger associated with the abnormal event. Use this identifier when checking station status, OCPP communication, or support logs. |
| Connector SEQ | Identifies the connector sequence associated with the event. Available sequence values depend on the number of connectors provided by the charger; the live page includes values such as 0 and 1. |
| Timestamp | Shows the event-log time in an ISO 8601 timestamp. Current live values end in Z, indicating UTC, and can include fractional seconds. |
| Event Type | Shows the abnormal-event category selected by the platform, such as Charger offline or Abnormal session termination. |
| Event | Provides View Events, which opens the technical event payload. |
| Description | Provides View Description, which opens a readable summary of the event. |
| EVSE Make | Shows the recorded EVSE manufacturer or make. |
| EVSE Model | Shows the recorded EVSE model. |
Grid header controls
The ten grid columns do not currently provide active column-level sorting or filtering. Use the page-level date, location, charger, and event-type filters to narrow the result set.
The separate Column Filter control changes which columns are visible; it does not filter event values.
Viewing the technical event payload
Select View Events in the required row to open the Event dialog. The dialog displays the technical event payload in JSON format.
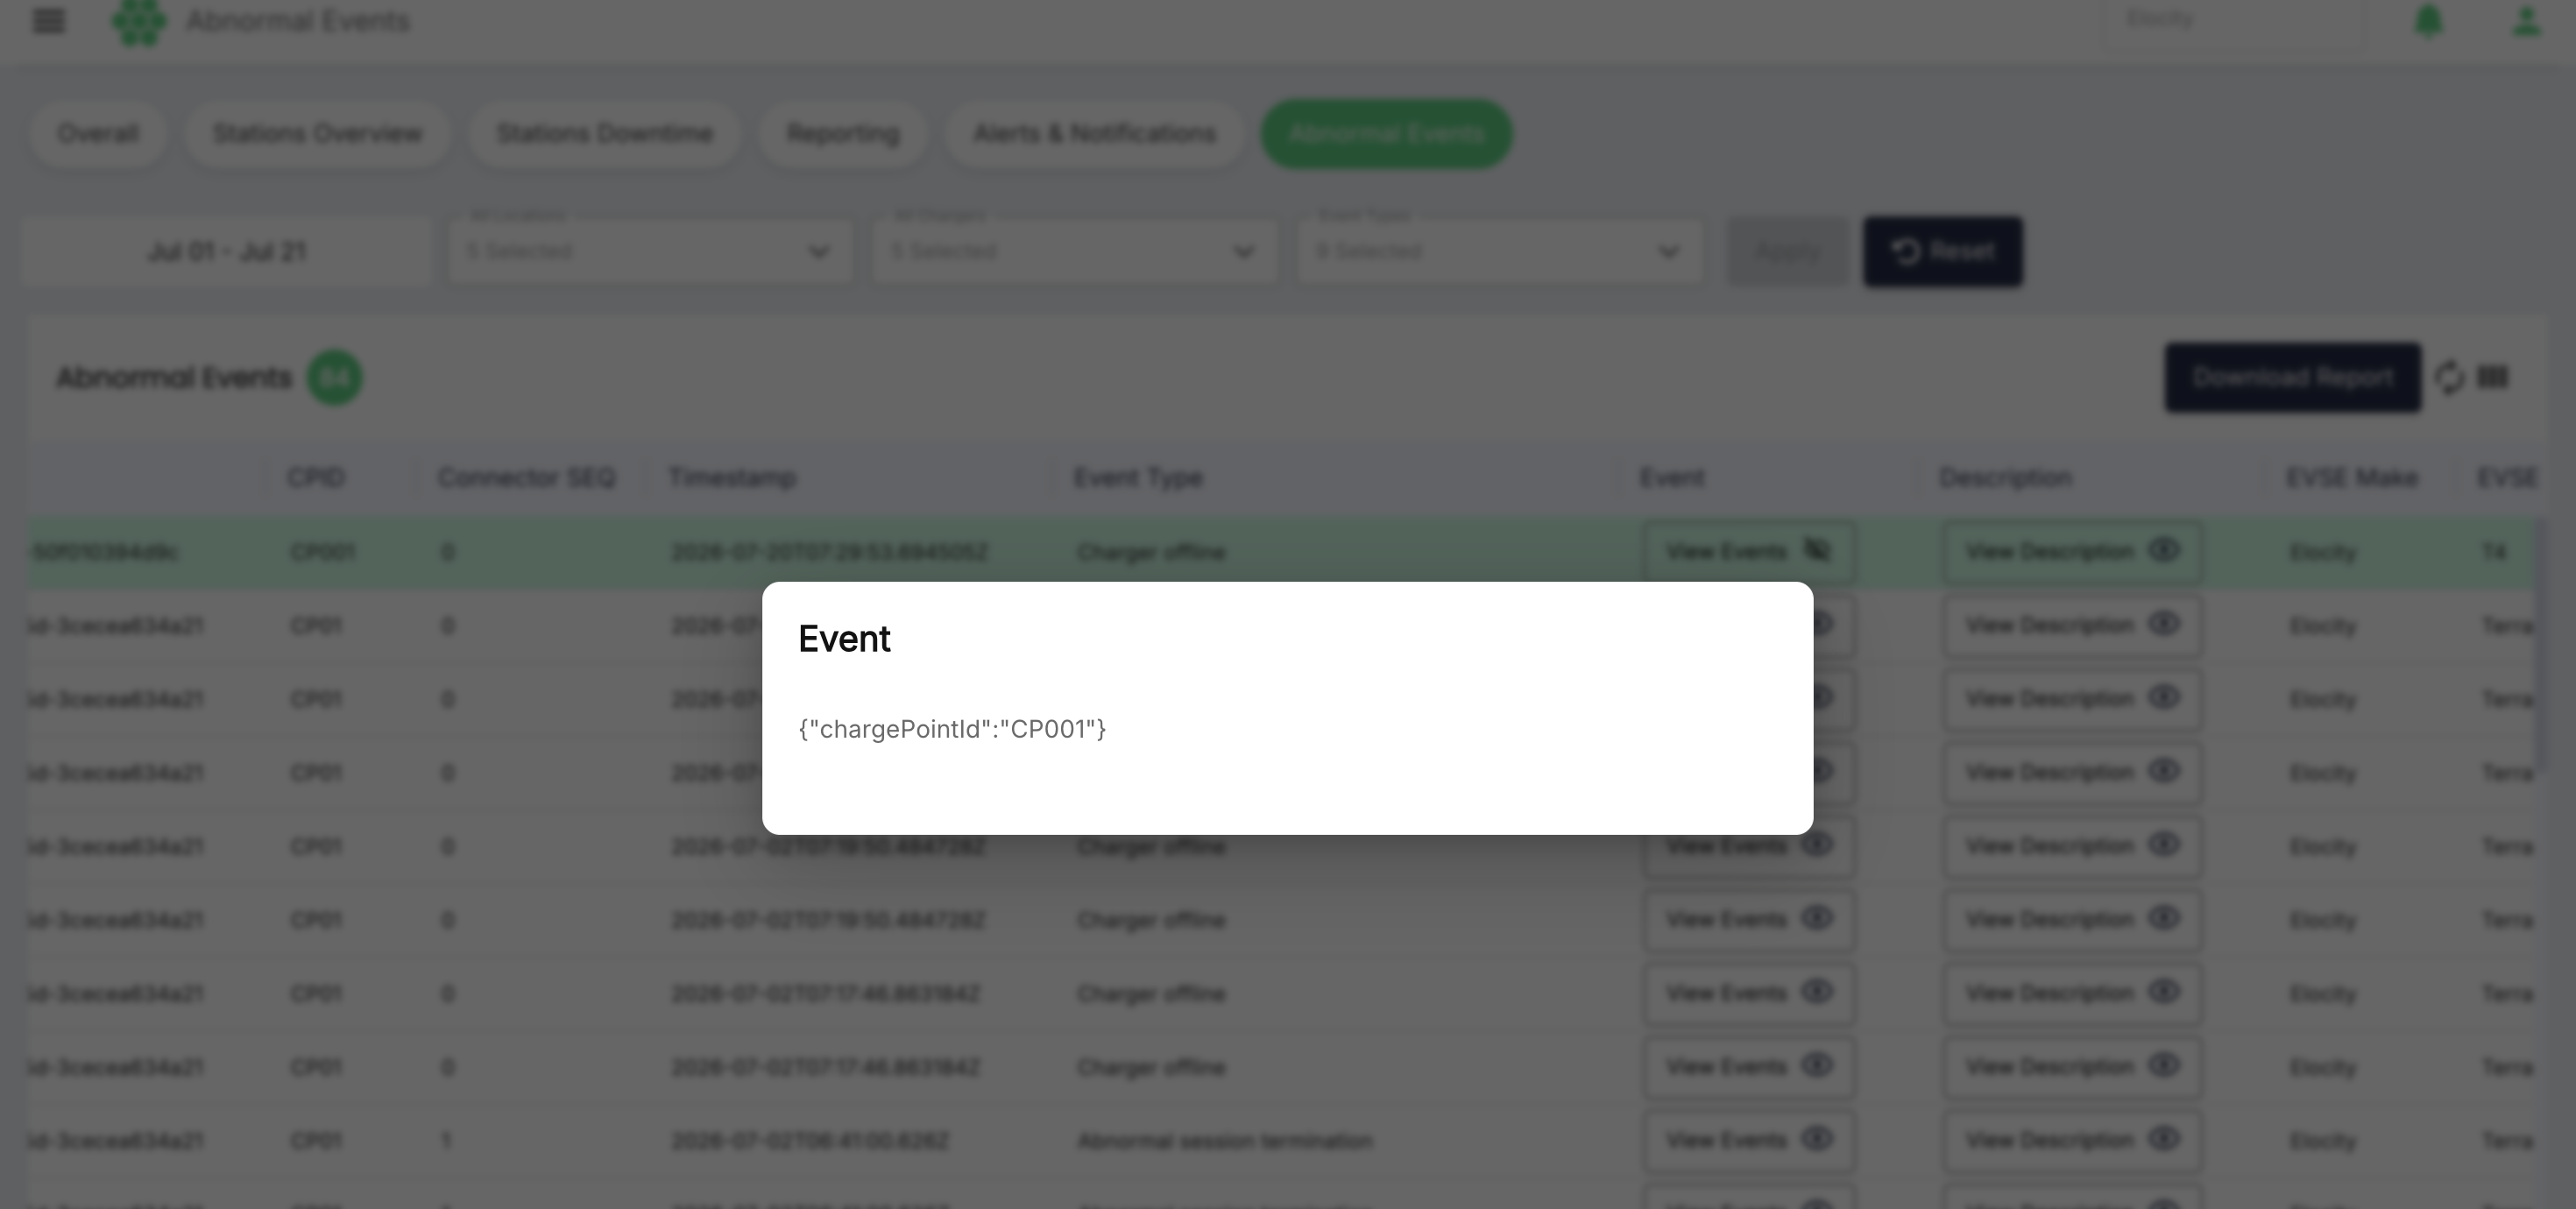
The payload varies by event type. Live examples show:
- A Charger offline event containing the associated
chargePointId. - An Abnormal session termination event containing fields such as the producing charger, consumer value, authorization identifier, final meter value, UTC timestamp, transaction ID, termination reason, and authorization status information.
Use the payload when correlating the abnormal event with OCPP messages, charging-session data, or backend logs. Field availability depends on the event type, and a field should not be interpreted beyond its recorded value without the applicable product or protocol definition.
The raw Event JSON is available to every user who is authorized to access this page. Refer to the available event-field glossary when interpreting event-specific fields.
Event payloads can contain operational or customer-related identifiers. Share or export them only in accordance with the organization's access, privacy, and data-retention requirements.
Viewing the event description
Select View Description in the required row to open the Description dialog. The dialog provides a readable summary of the detected condition.
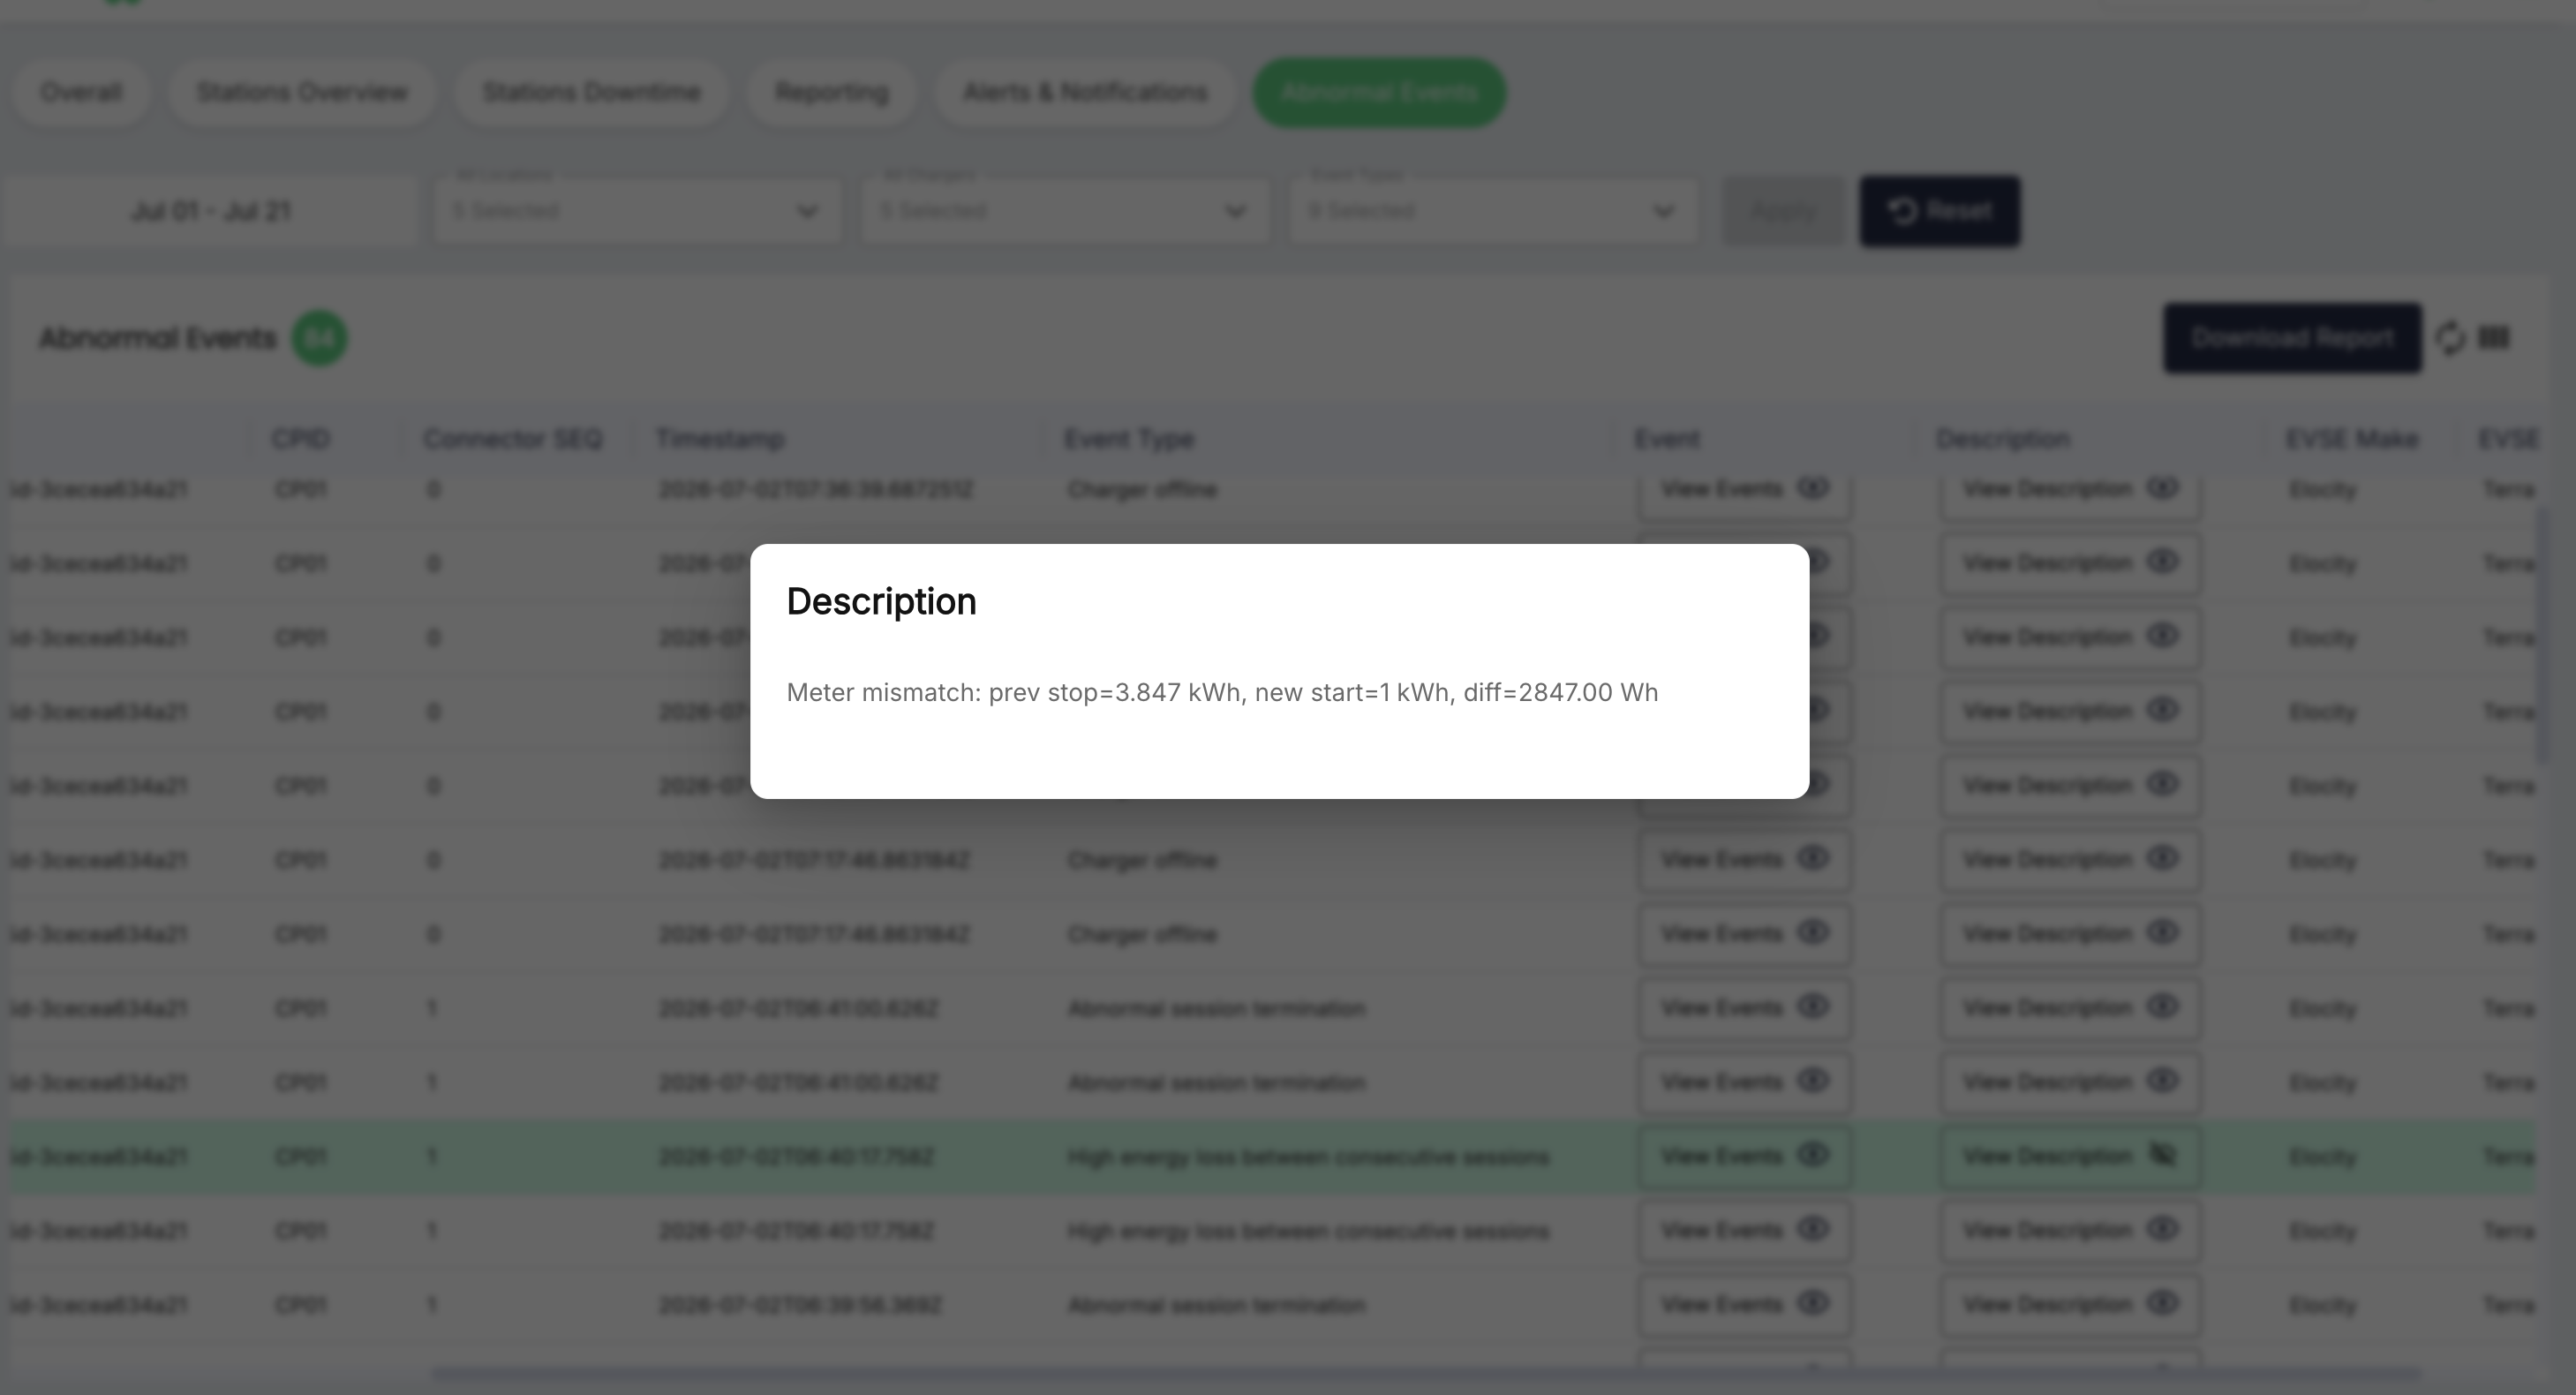
Live examples include:
Charge box is offlinefor a Charger offline record.- A message identifying the affected transaction for an Abnormal session termination record.
Review the description together with the Event Type and technical payload. The description summarizes the record but does not replace technical verification.
Showing and hiding columns
Select Column Filter to open the Show / Hide Columns menu. All ten grid columns can be selected or cleared:
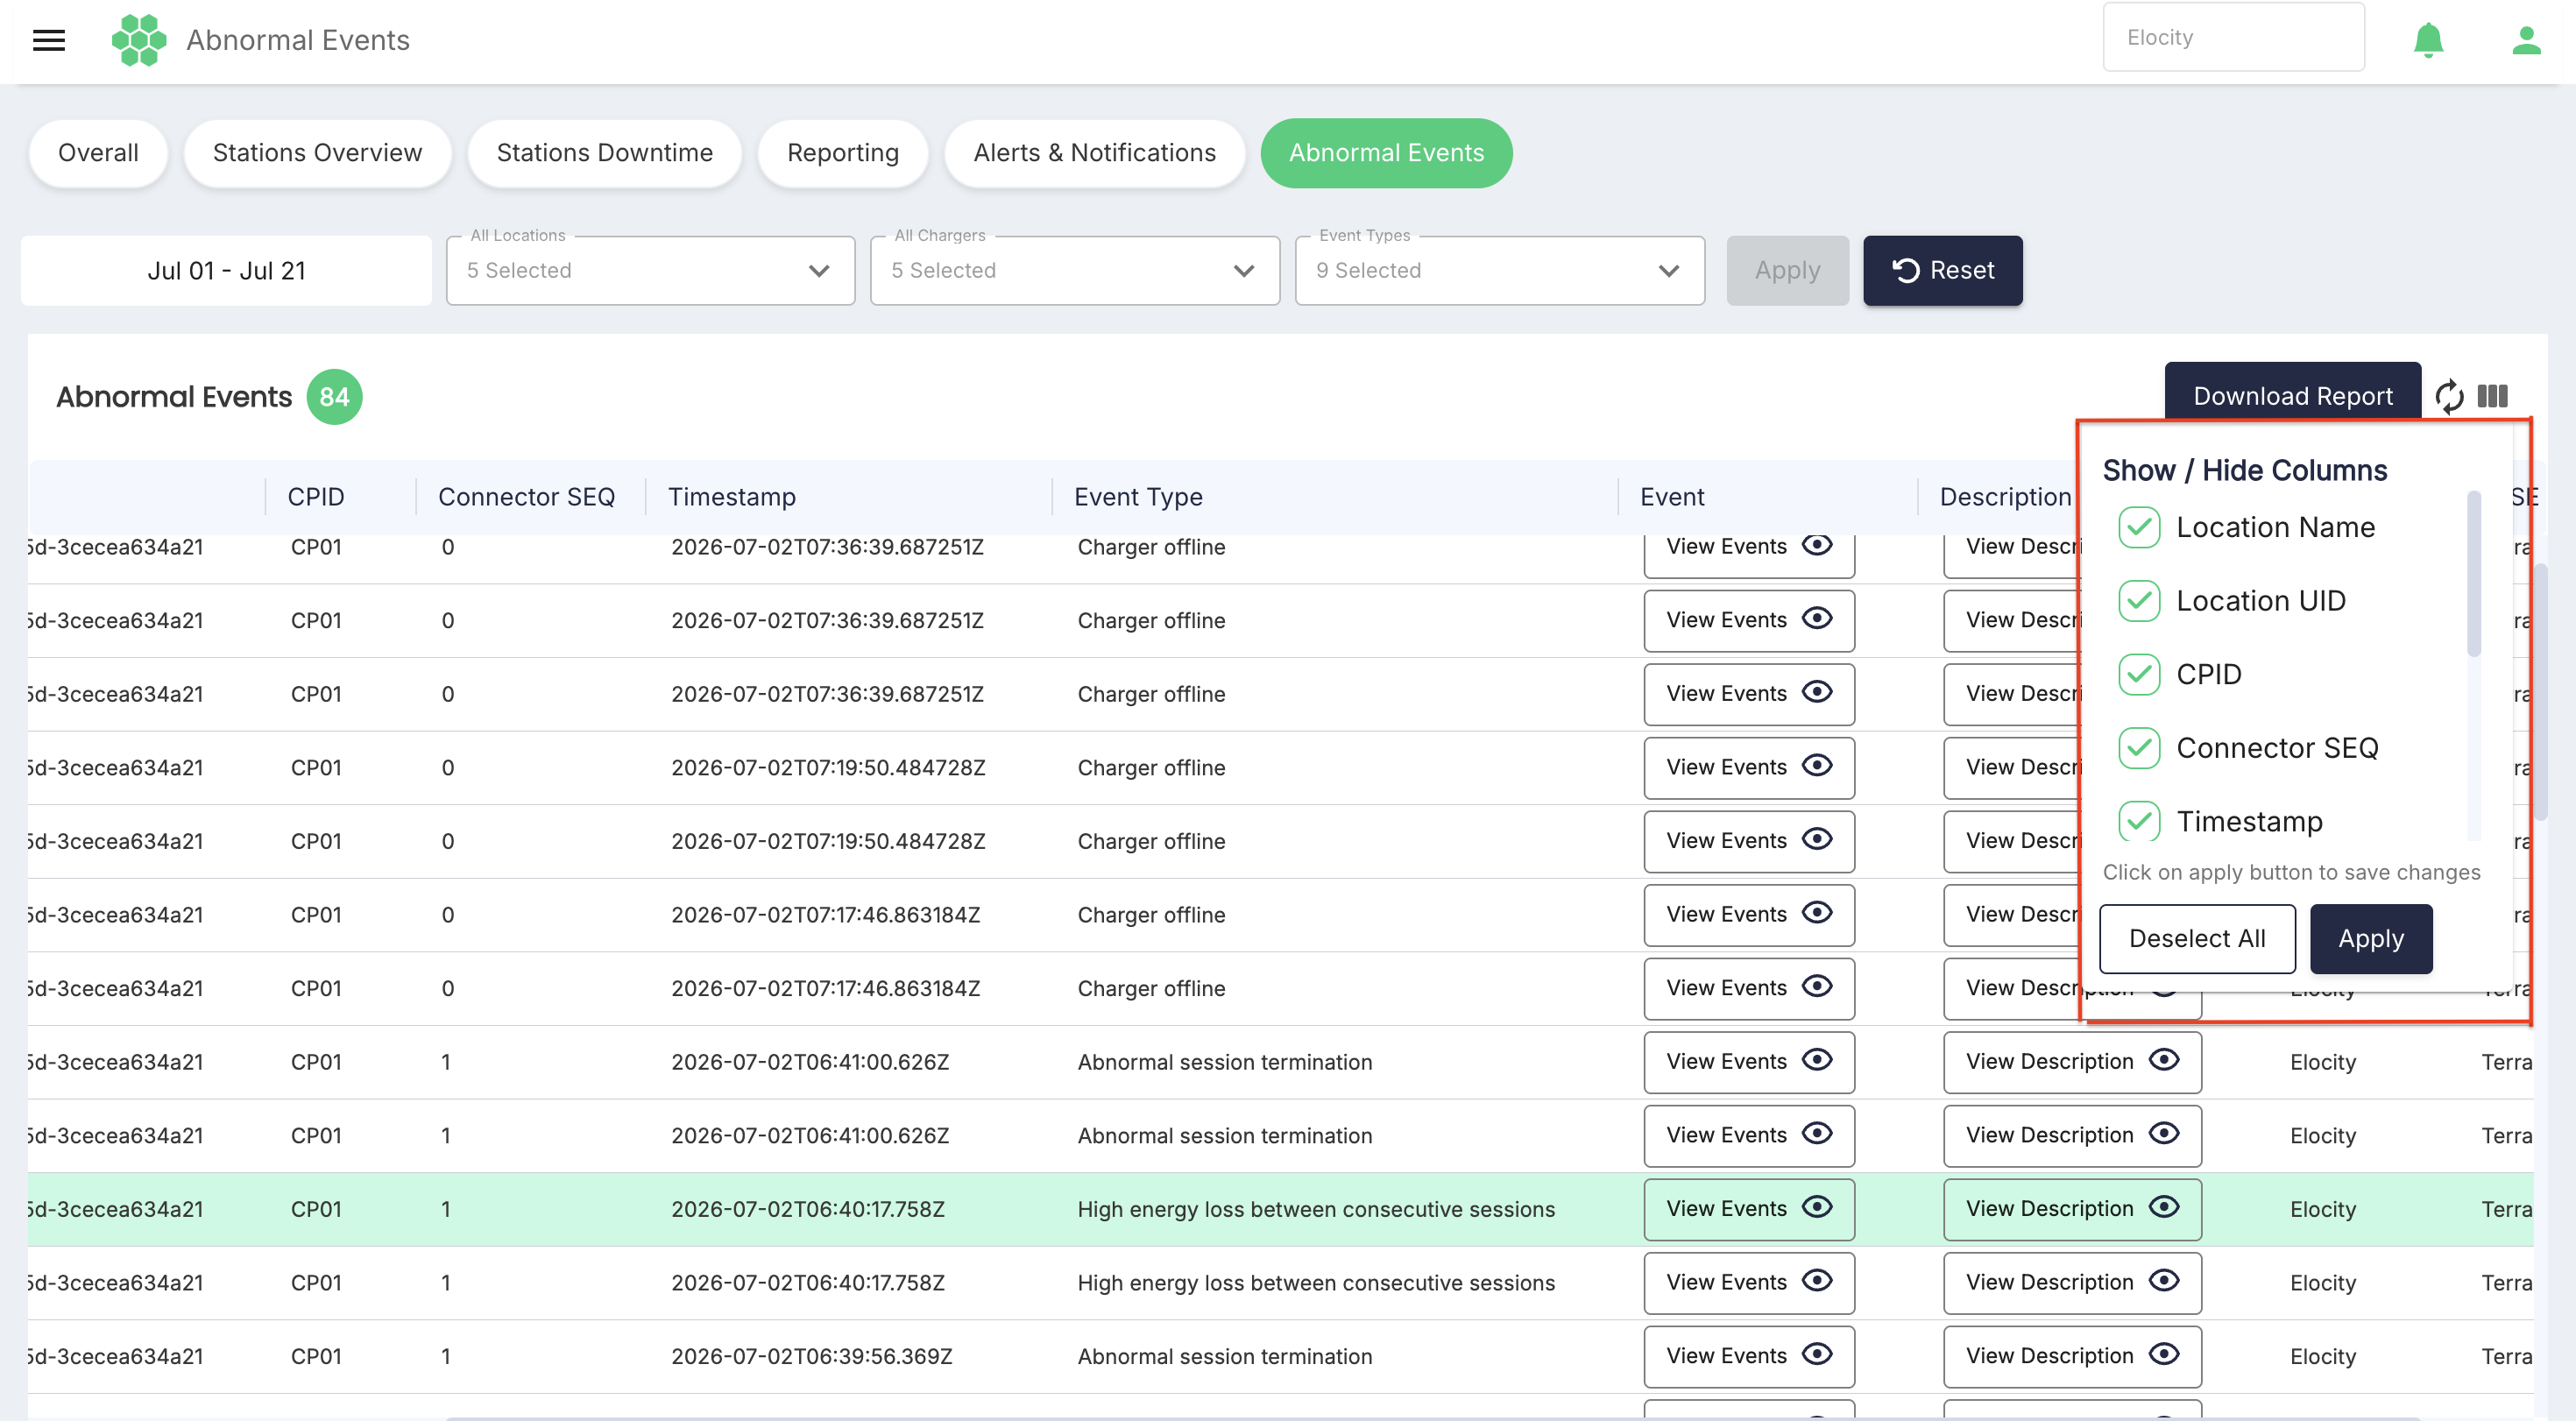
- Location Name
- Location UID
- CPID
- Connector SEQ
- Timestamp
- Event Type
- Event
- Description
- EVSE Make
- EVSE Model
Select Apply inside the column menu to save the visible-column selection. Select Deselect All to clear all column selections.
Column visibility changes the on-screen grid layout; it does not change the underlying event records.
Hiding a column does not remove it from a downloaded report.
Infinite scrolling
The grid uses infinite scrolling. It initially displays part of the selected result set. When the user reaches the bottom of the loaded rows, the application requests additional records from the backend and adds them to the grid.
Continue scrolling to review later records. The counter represents all events matching the selected filters, not only the rows currently loaded on screen.
Refreshing the data
Select Refresh to request the latest available abnormal-event data. Refresh before confirming whether a recent incident is present or before making a time-sensitive operational decision.
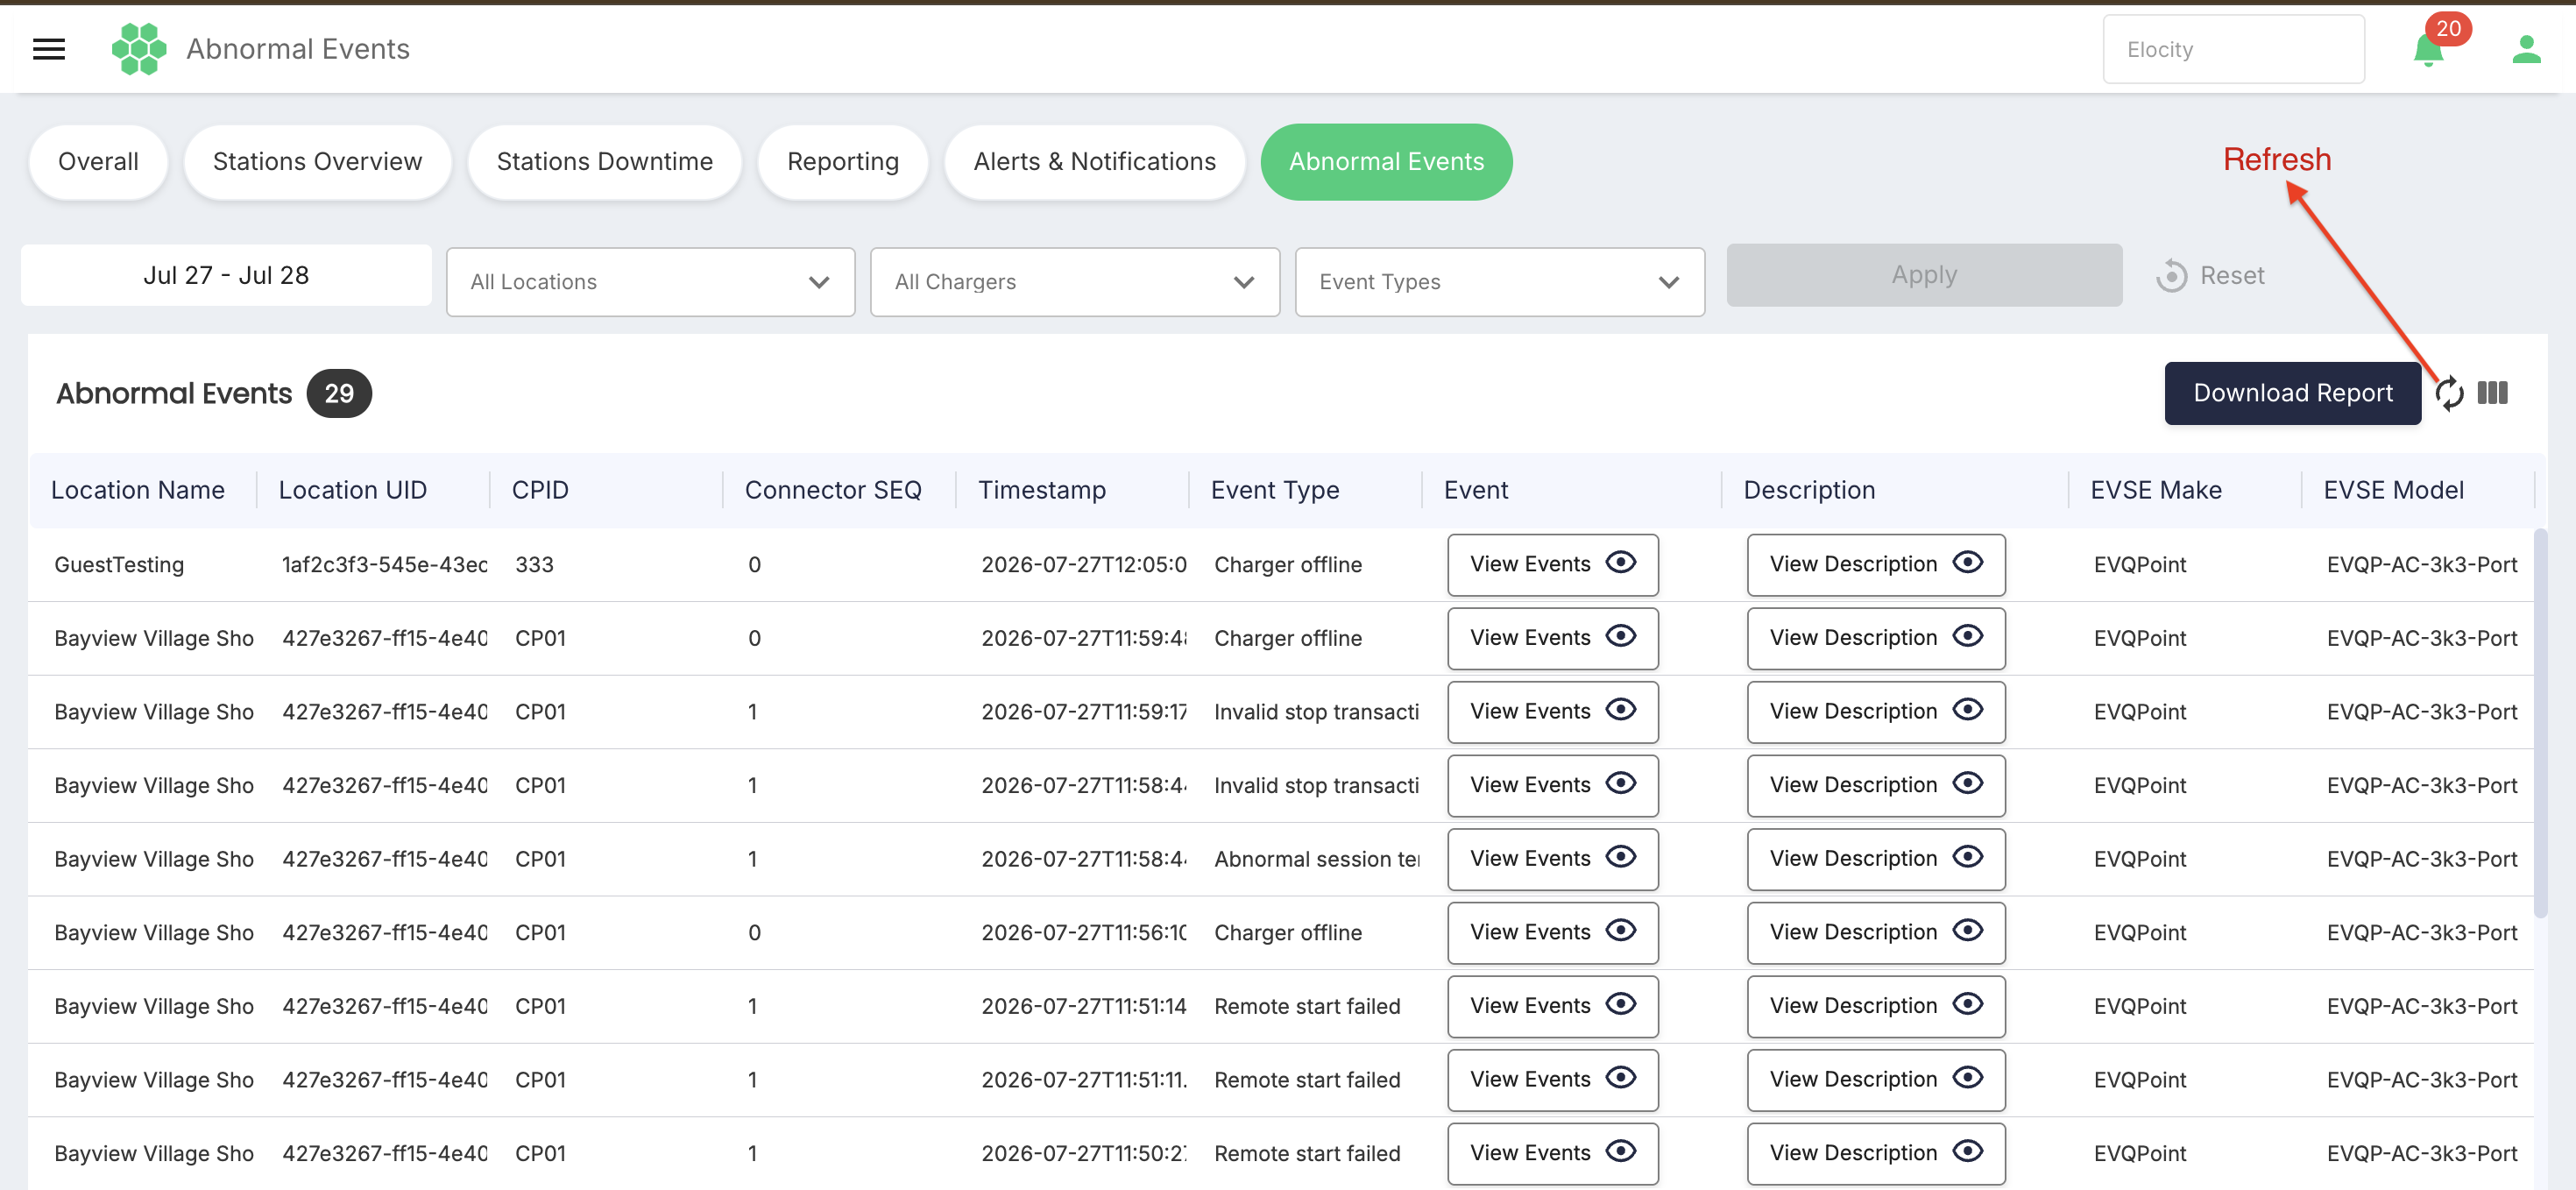
After refreshing, confirm that the intended business, date range, and dropdown selections are still displayed.
Downloading the report
Select Download Report to export abnormal-event records in CSV format for offline analysis or authorized operational record keeping.
Before downloading:
- Confirm the selected business.
- Choose the required date range.
- Select the required locations, chargers, and event types.
- Select Apply.
- Review the event counter and visible rows.
- Select Download Report.
The CSV contains all columns and all abnormal events matching the selected filters. It is not limited to the rows currently loaded through infinite scrolling, and columns hidden from the on-screen grid remain included in the export.
Event availability and lifecycle
Abnormal events are currently made available to operators for review. The page is read-only and does not provide controls to acknowledge, assign, resolve, dismiss, or link an event to a support case.
Recommended investigation workflow
- Select the affected business.
- Choose the incident period using a preset or custom date range.
- Select the affected location and charger, when known.
- Select the relevant event type or types.
- Select Apply and review the result counter.
- Locate the event using the Location Name, CPID, Connector SEQ, and Timestamp.
- Select View Description for the readable event summary.
- Select View Events to examine the technical JSON payload.
- Record the Location UID, CPID, connector value, timestamp, and transaction identifier when escalating the issue.
- Convert the UTC event timestamp and any browser-timezone value to the same timezone before comparing records.
- Check the latest charger and connector status to determine whether the condition remains active.
- Correlate the record with OCPP messages, charging-session data, payment data, or backend logs as applicable.
- Select Refresh before making a final operational assessment.
- Select Download Report when the filtered records must be retained or shared with an authorized team.
Interpretation notes
- Repeated rows for the same CPID can represent separate abnormal-event occurrences.
- A Charger offline record does not establish whether the underlying cause was power, networking, hardware, software, configuration, or another condition.
- A connector-related record should be correlated using the CPID and Connector SEQ.
- An event timestamp ending in
Zis expressed in UTC. Convert it before comparing it with a browser-timezone value from another portal page. - A historical abnormal event does not confirm the charger's current state.
- The technical Event payload and readable Description serve different purposes and should be reviewed together.
- Event categories are triggered from charger or connector states and the quality of data received by the server from the charger.
- The counter and CSV cover the complete filtered result set, even when infinite scrolling has loaded only part of it on screen.
- All grid columns remain present in the CSV, regardless of the visible-column configuration.
- The page is currently read-only for operators.
- Totals and available filters can differ between users because of business assignments and permissions.