Viewing Reports
Utility Tariff Report
The Reports tab provides graphical insights into electricity costs configured through utility tariffs and helps administrators analyze energy expenses alongside charging revenue. These reports enable better monitoring of operational costs, profitability, and revenue trends across the charging network.
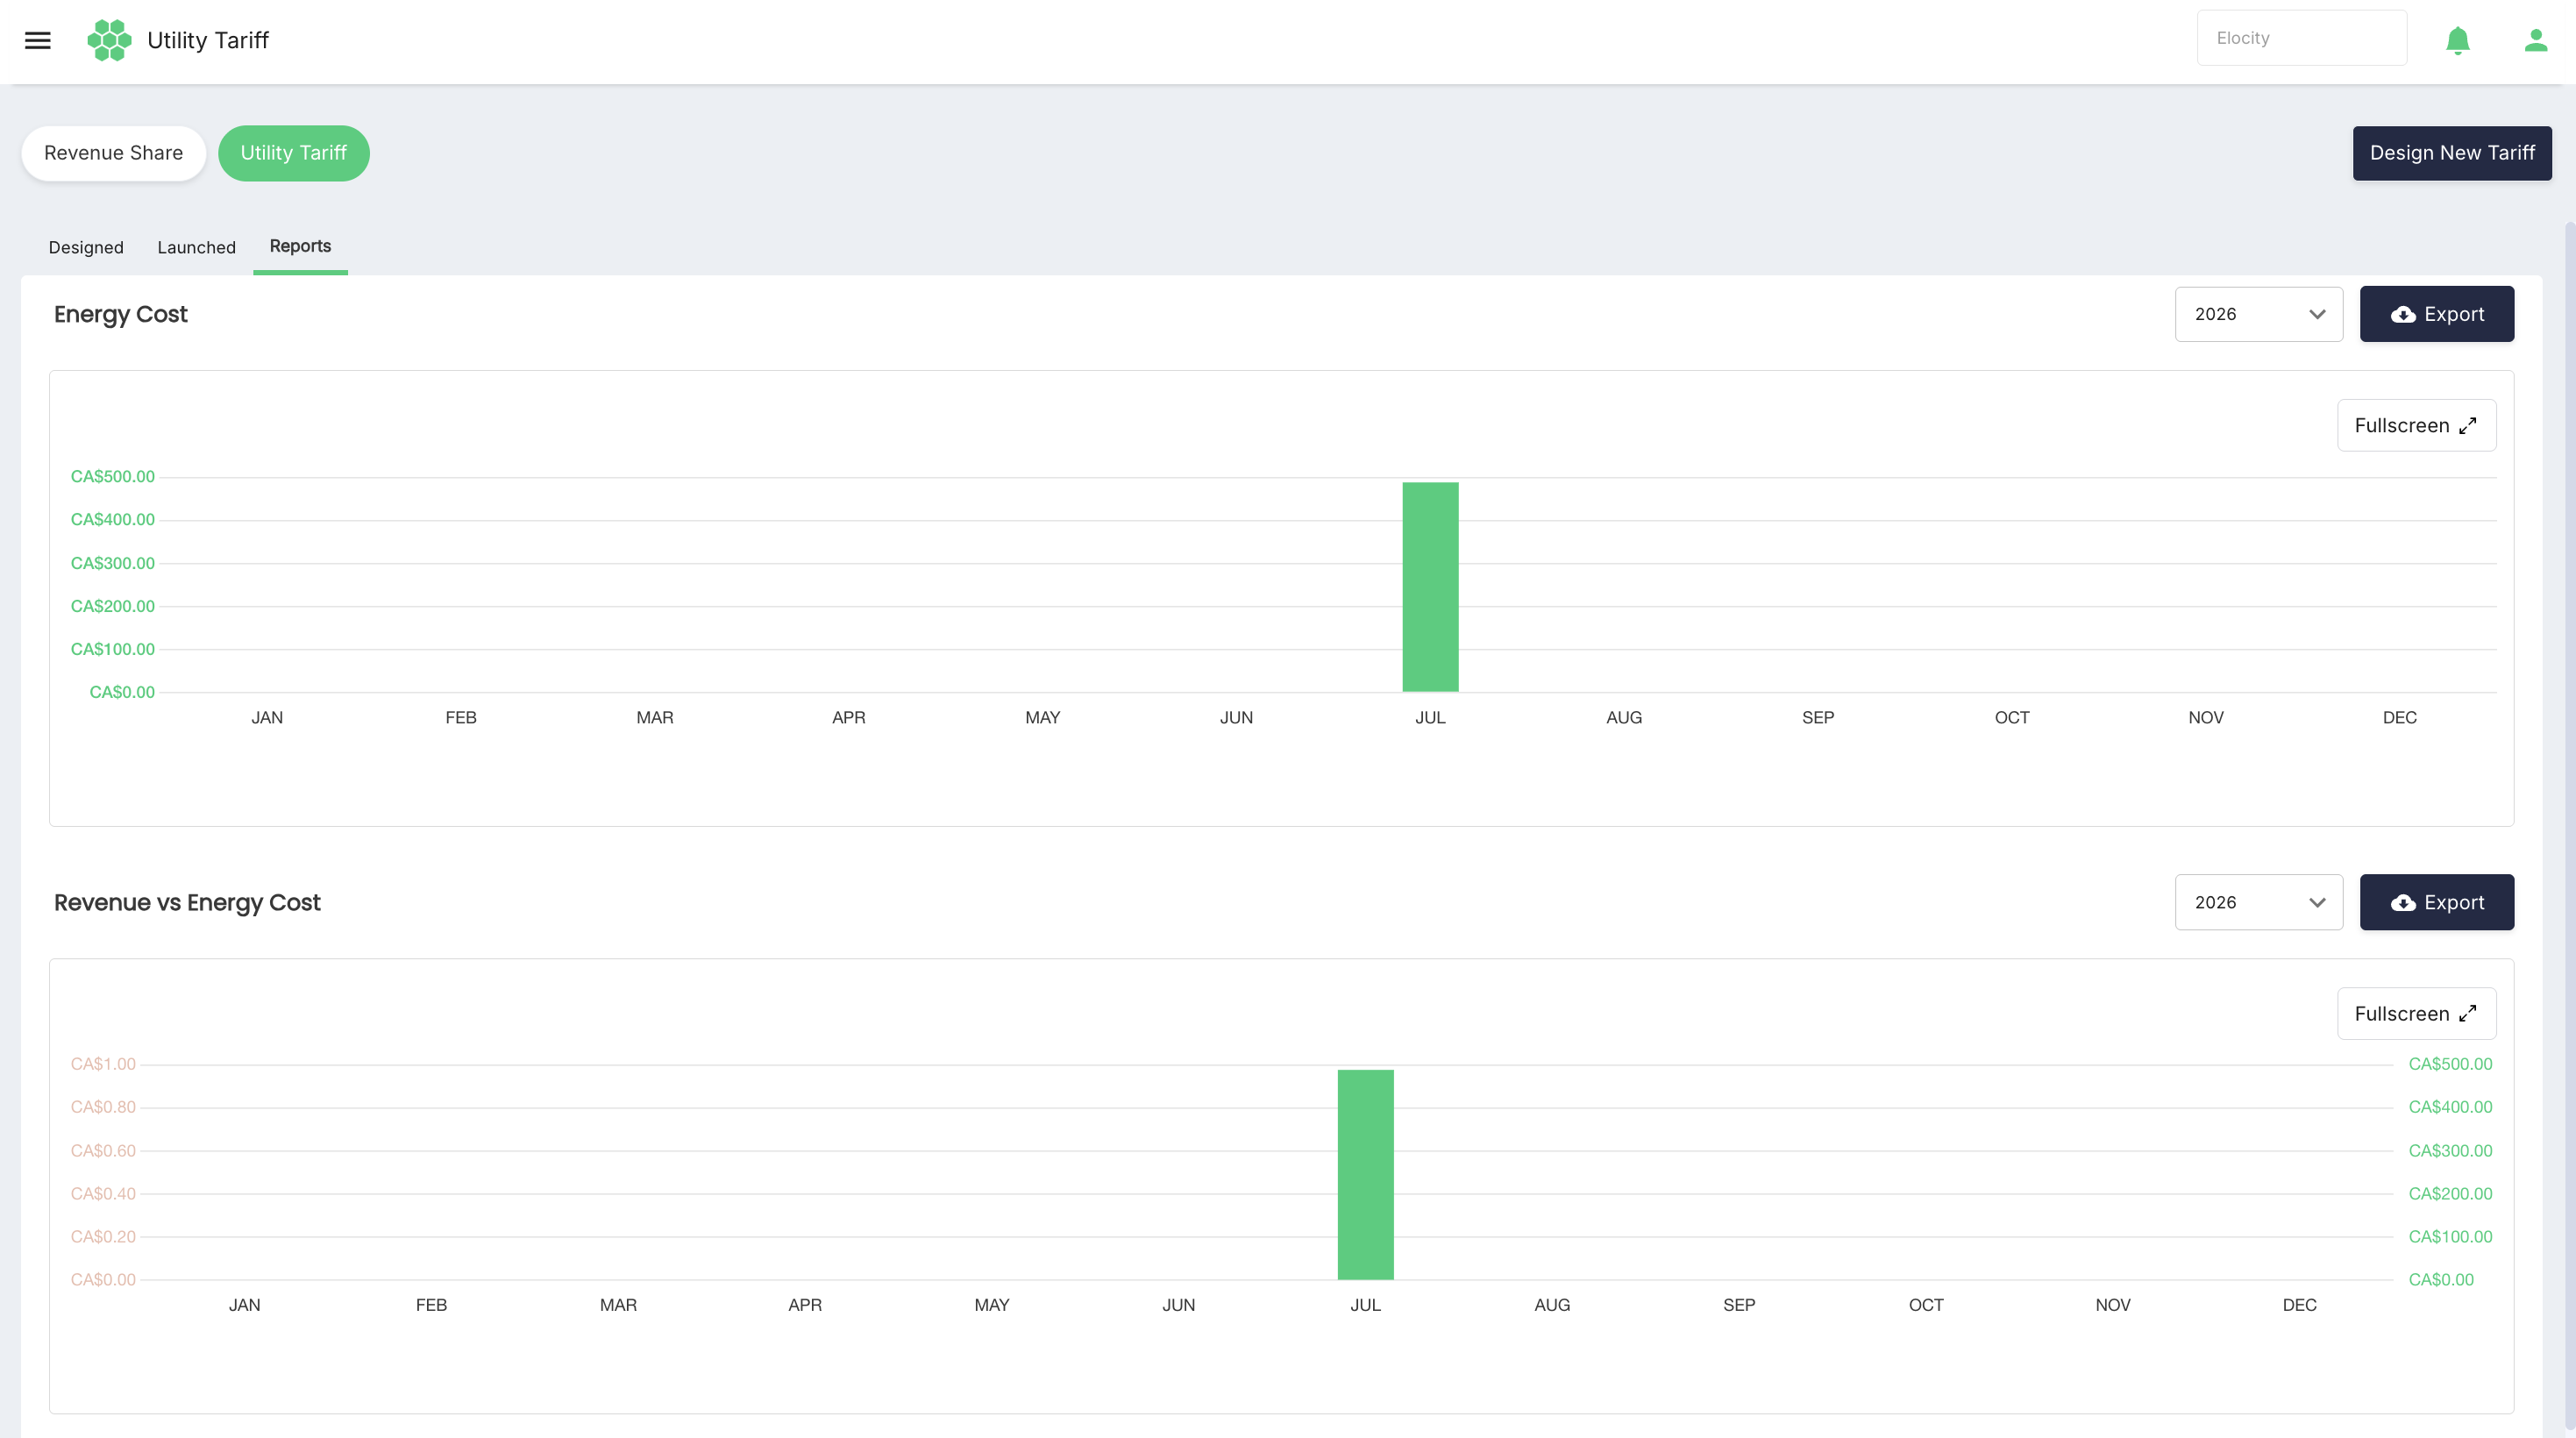
Navigate to Revenue Share > Utility Tariff > Reports. The following screen appears.
Energy Cost
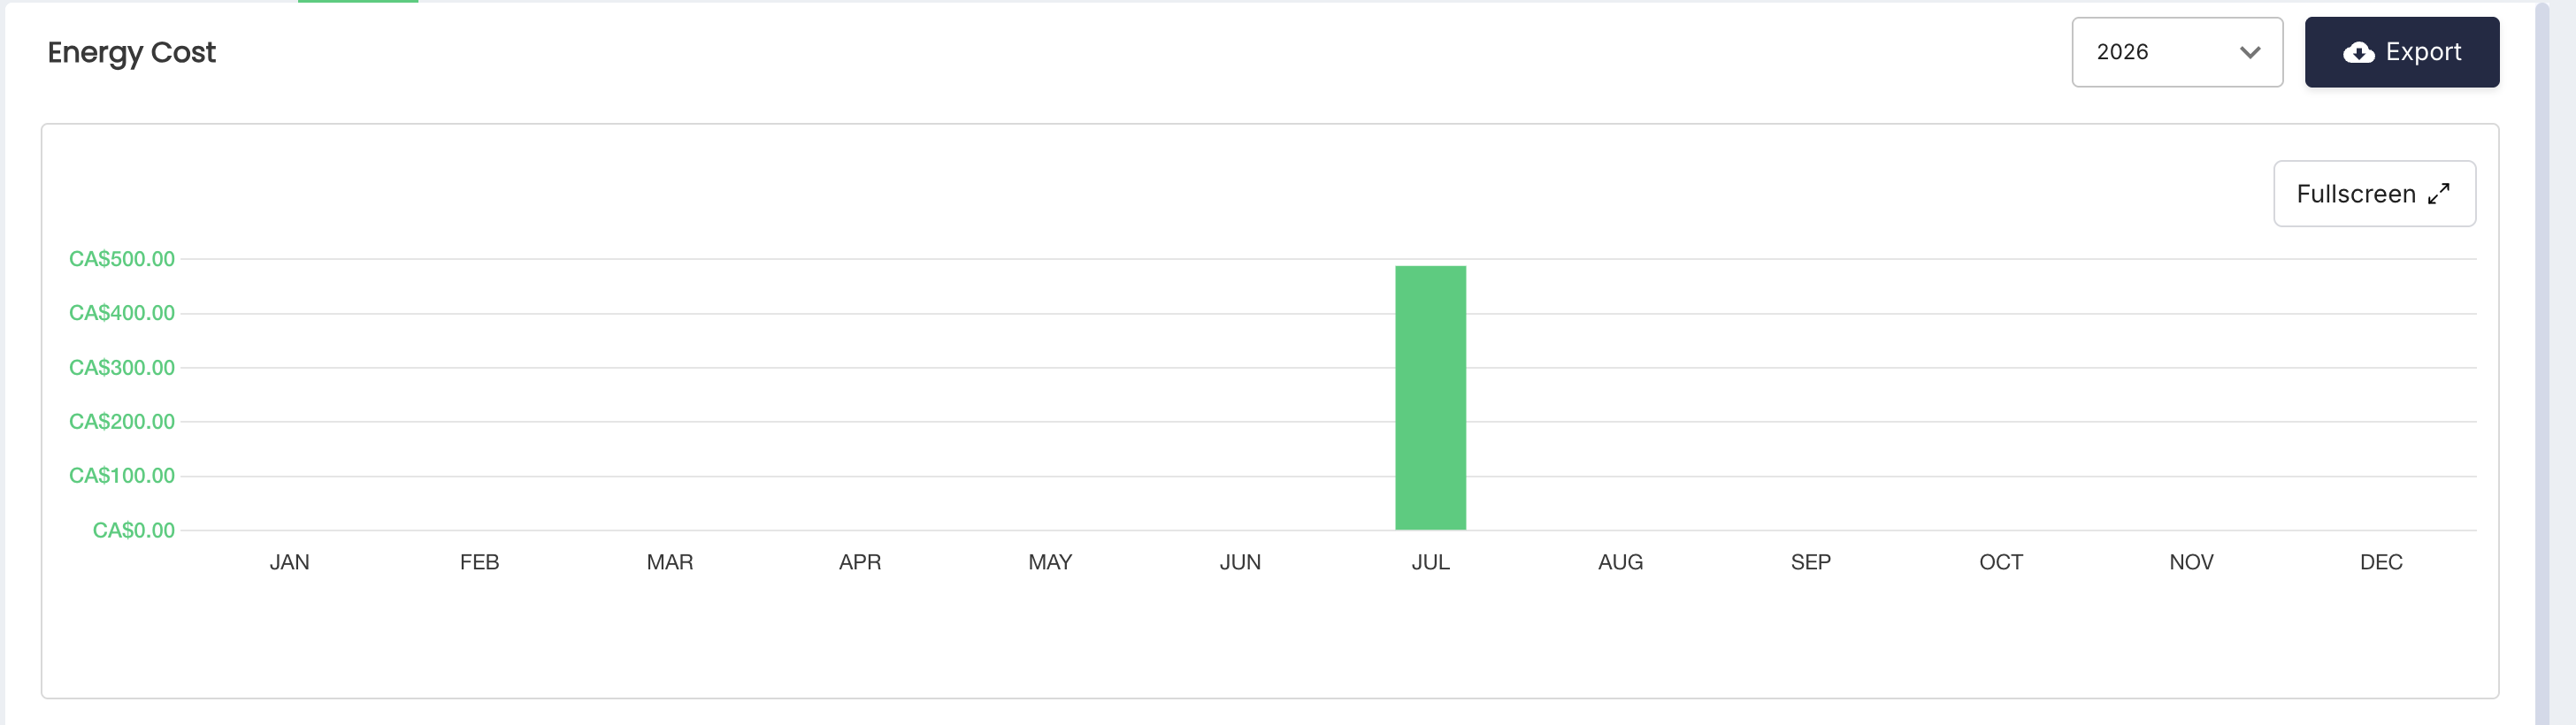
The Energy Cost chart displays the total electricity cost incurred for each month based on the configured utility tariff. Administrators can select the required year to view annual cost trends, analyze monthly energy expenses, and export the report for further analysis or record keeping.
Revenue vs Energy Cost
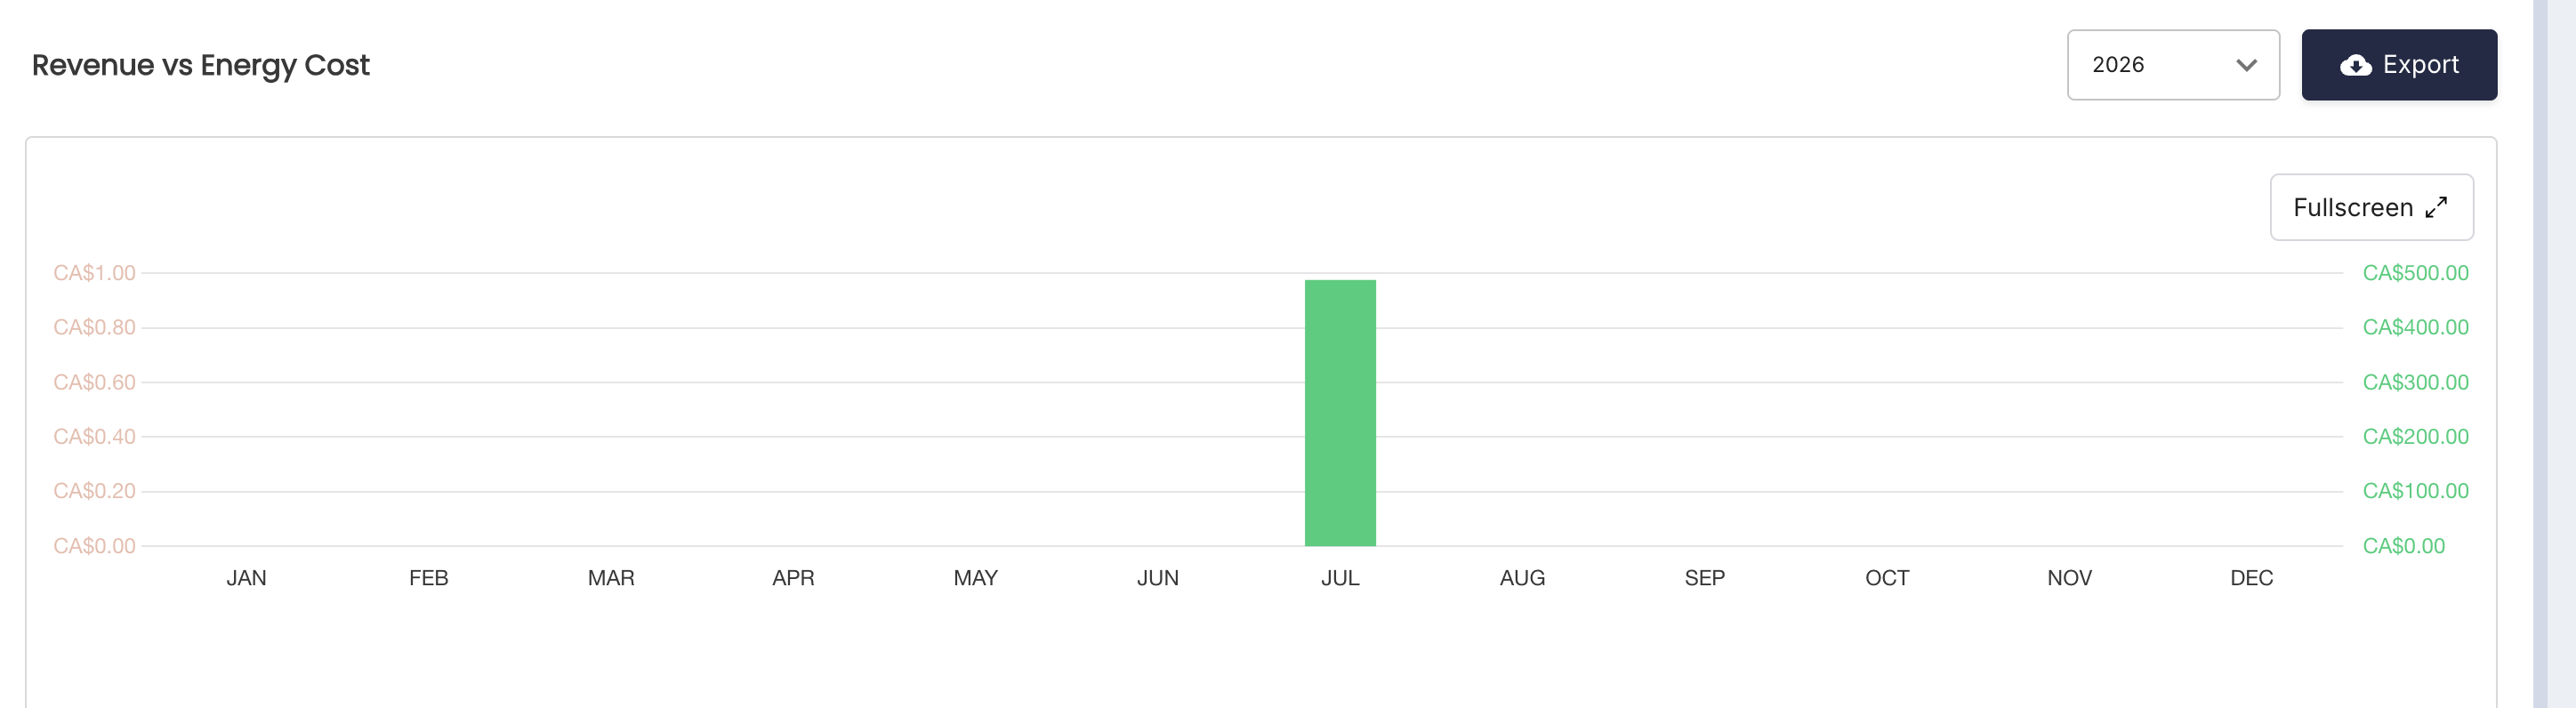
The Revenue vs Energy Cost chart compares the revenue generated from charging sessions against the corresponding electricity cost for each month. This comparison helps administrators evaluate operational profitability, identify cost patterns, and make informed decisions for tariff planning and revenue optimization.
You can perform the following actions in both the reports:
- Filter: You can use the year-wise filtering option for both the reports by selecting the required year from the drop-down list.
- Fullscreen View: You can view the reports in fullscreen view by clicking on the fullscreen icon in the top-right corner of the report.
- Export Report: You can export the reports by clicking on the export icon in the top-right corner of the report.